FxMath Harmonic Patterns EA
Smart Harmonic Patterns Market Scanner
Draws Harmonic Patterns On Chart Include Pattern Name
Calculates Open Price, StopLoss and TakeProfit
Working in any Markets and TimeFrame
Harmonic Patterns:
Harmonic price patterns take geometric price patterns to the next level by using Fibonacci numbers to define precise turning points. Unlike other trading methods, Harmonic trading attempts to predict future movements. This is in vast contrast to common methods that are reactionary and not predictive.
Combine Geometry and Fibonacci Numbers
Harmonic trading combines patterns and math into a trading method that is precise and based on the premise that patterns repeat themselves. At the root of the methodology is the primary ratio, or some derivative of it (0.618 or 1.618). Complementing ratios include: 0.382, 0.50, 1.41, 2.0, 2.24, 2.618, 3.14 and 3.618. The primary ratio is found in almost all natural and environmental structures and events; it is also found in man-made structures. Since the pattern repeats throughout nature and within society, the ratio is also seen in the financial markets, which are affected by the environments and societies in which they trade.
Issues with Harmonics
Harmonic price patterns are extremely precise, requiring the pattern to show movements of a particular magnitude in order for the unfolding of the pattern to provide an accurate reversal point. A trader may often see a pattern that looks like a harmonic pattern, but the Fibonacci levels will not align in the pattern, thus rendering the pattern unreliable in terms of the Harmonic approach. This can be an advantage, as it requires the trader to be patient and wait for ideal set-ups.
Most Harmonic Patterns:
Gartley, Bat, Shark, Butterfly, 121, Total3, Crab,…

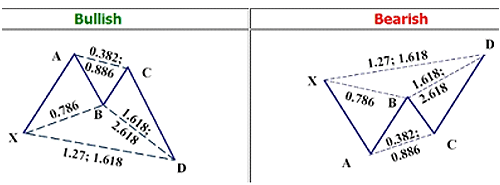
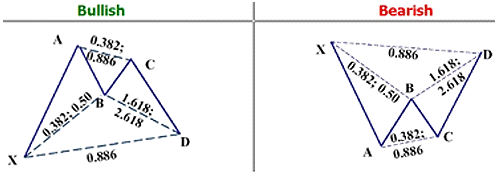
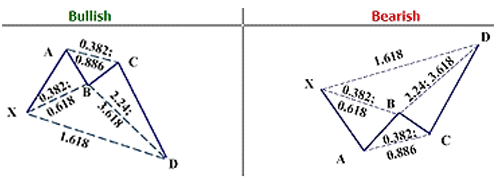
The Butterfly Pattern

The Bat Pattern

The Crab Pattern
Win Rate for Harmonic Patterns strategy is more than 80%
Harmonic Pattern is 100% pure action method and is not sensitive to broker or data feed. This strategy is working for any finance market same Forex, Futures, Options,…. . Each pattern provides a PRZ. This is not an exact level, as two measurements – extension or retracement of XA – creates one level at D and the extension of BC creates another level at D. This actually makes D a zone where reversals are likely. Traders will also notice that BC can have differing extension lengths. Therefore, traders must be aware of how far a BC extension may go. If all projected levels are within close proximity, the trader can enter a position at any area. If the zone is spread out, such as on longer-term charts where the levels may be 50 pips or more apart, it is important to wait to see if the price reaches further extension levels of BC before entering a trade.
Stops can be placed outside the largest potential extension of BC. In the crab pattern, for example, this would be 3.618. If the rate reversed before 3.618 was hit, the stop would be moved to just outside the closed Fibonacci level to the rate low (bullish pattern) or rate high (bearish pattern) in the PRZ.
FxMath Harmonic Patterns Package
FxMath Harmonic Patterns packages is include Indicator for scans market, finds patterns, draws those and Expert Advisors(EA) for executes generated signals by Indicator. EA is 100% automated and calculates Open Price, StopLoss, TakeProfit. EA opens trade, modify trade, set hard stoploss and takeprofit. Risk: Reward is maximum 1:2, It means TakeProfit is minimun 2 times bigger than Stoploss.
Some Example For Harmonic Patterns Accuracy


List of Harmonic Patterns
-
ABC Bullish/Bearish
-
AB=CD Bullish/Bearish
-
3-Drives Bullish/Bearish
-
Gartley Bullish/Bearish
-
Butterfly Bullish/Bearish
-
Bat Bullish/Bearish
-
Crab Bullish/Bearish
-
Shark Bullish/Bearish
-
Cypher Bullish/Bearish
The above list is for classic patterns, but there are more patterns that not popular. In our package we collect more than 80 different patterns and will increase number of those in futures.
How to Trade Harmonic Patterns
Pattern Identification
Harmonic pattern identification can be bit hard with the naked eye, but once a trader understands the pattern structure it can be relatively easily spotted by Fibonacci tools. The primary Harmonic patterns are 5-point (Gartley, Butterfly, Crab, Bat, Shark and Cypher) patterns. These patterns have embedded 3-point (ABC), 4-Point (ABCD) patterns. All the price swings between these points are inter-related and have harmonic ratios based on Fibonacci. Patterns are either forming or completed ‘M’ or ‘W’ shaped structures or combinations of ‘M’ and ‘W’, in the case of 3-drives. Harmonic patterns (5-point) have a critical origin (X) followed by an impulse wave (XA) followed by a corrective wave to form the ‘EYE’ at (B) completing AB leg. Then followed by a trend wave (BC) and finally completed by a corrective leg (CD). The critical harmonic ratios between these legs determine whether a pattern is a retracement based or extension based pattern and defines its names (Gartley, Butterfly, Crab, Bat, Shark and Cypher). One of the significant point to remember is: All 5-point and 4-point Harmonic patterns have embedded ABC (3-Point) patterns.
All 5-point Harmonic patterns (Gartley, Butterfly, Crab, Bat, Shark, Cypher) have similar principles and structures, and they differ by their ratios to identify them and locations of key nodes (X, A, B, C, D) but once one of the patterns is understood it may be relatively easy to grasp knowledge of others. It may help for traders to use an automated pattern recognition software to identify these patterns than using naked eye to find or force these pattern identification.
Trade Identification
In harmonic pattern setups, a trade is identified when the first 3 legs are completed (in 5-point patterns). For example, in Gartley Bullish pattern, when XA, AB, BC legs are completed and it starts to form CD leg, you would identify the potential trade may be in works. Using the projections and retracements of XA, BC legs and Fibonacci ratios we build a price cluster to identify potential Price completion zone (PCZ) and D point of the pattern.

Pattern Completion Zone (PCZ)
All Harmonic patterns have defined Pattern Completion Zones (PCZ). These PCZs are also known as price clusters formed by the completed swing (legs) confluence of Fibonacci extensions, retracements and price projections. Pattern supposed to complete its CD leg (also complete D) in this zone (PCZ) and reverse. Trades are anticipated in this zone and entered on price reversal action.
As an example, Pattern Completion Zone (PCZ) for Bullish Gartley pattern is constructed using following Fibonacci extensions and projections:
0.78 XA
1.27 BC
1.62 BC
AB = CD
Here is an example of Potential Completion Zone (PCZ) formation:

Trade Entries and Stops
Trading Harmonic patterns with computed entry levels are this author’s preference rather than trading them blindly at retracement levels or reversal zones advocated by Harmonic trading pundits. Most Harmonic traders anticipate the pattern to reverse and attempt to trade these patterns in the “reversal zone” and end up taking contrarian (counter trend) trades. To enter a trade, I prefer a confirmation of reversal price-action combined with a reversal trend change from the “reversal zones.”
Most Harmonic Pattern trade entries occur around ‘D’ point within the reversal zone. It could be a Buy (in bullish patterns) or a Sell (in bearish patterns). Usually, ‘D’ is identified by a confluence of projections, retracements and extensions of prior swings (legs), universally called as “reversal zone.” In my view, when prices started to reach this zone, it is signaling an opportunity for potential trade, not a signal to trade yet. The entry criteria and pattern validity are determined by various other factors like current volatility, underlying trend, volume structure within the pattern and market internals etc. If the pattern is valid and the underlying trend and market internals agreeing with the Harmonic pattern reversal, then Entry levels (EL) can be calculated using price-ranges, volatility or some combination. Stop is placed above/below the last significant pivot (in 5 and 4-Point patterns it is below D for the bullish pattern, above D for bearish patterns).
Target Zones
Target zones in Harmonic patterns are computed based on the retracement, extensions or projections of impulse/corrective swings and Fibonacci ratios from the action point of the pattern structure. For example, in Gartley bullish pattern, the target zones are computed using XA leg from the trade action point (D). The projections are computed using Fib. ratios like 62%, 78.6% of XA leg and added to the action point (D). The extension ratios like 1., 1.27, 1.62, 2., 2.27, 2.62 are computed for potential target levels. The primary target zones are marked computed from D as 62%-78.6% of XA leg as the first target zone and 127%-162% as the second target zone.
Target Zone1: (D + XA*0.62) to (D+XA*.786)
Target Zone2: (D + XA*1.27) to (D+XA*1.62)
It is important to note that potential target zones in harmonic patterns are computed from probability standpoint and not from the certainty. Strong money and risk management rules and full working knowledge of the pattern are necessary for any pattern trading success.
Now FxMath Harmonic Pattern What Can Do For Me?
FxMath Harmonic Pattern(FHM) makes easy understanding Harmonic Patterns and trading those. FHM finds Patterns automatically, draws on chart, calculates Entry Price, StopLoss, TakeProfit and Patterns name. FHM EA execute generated signals automatically and manages your trades automatically. Finding Fibonacci Rations, patterns, entry price, stoploss and takeprofit is Time consuming and tedious and requires high skills. You can run FHM in your PC or VPS and receive Harmonic Patterns trade signals or allow FHM EA trades for you.
Some FxMath Harmonic Patterns Package Features:
- Compatible with all builds +600
- Easy Setup by only few clicks
- No need any special skills for running EA/Indicator
- Use in manual or automatically mode
- Working with any brokers support Metatrader 4
- User Manually for setup & settings
- Lifetime license and update
If you like trade professionally by advance strategy, FxMath Harmonic Patterns Package(FHM) is your best choice. We offer ultimate support for our package, release reports from executed trades, improving and update FHM always. You can purchase this great package and enjoy than your green profits.
Price: 249 USD

30 DAY MONEY BACK GUARANTEE
In the event we are unable to accord you product support or we are unable to fix a bug in the software within a reasonable time, you are entitled to our 30-day, no-hassle money-back guarantee. Your account will be credited promptly.
You are also entitled to a 12 Months Performance guarantee. What does this mean? If metaquotes were to do some changes like they did with build 600. You are entitled to a free update within one year from your date of purchase.
