FxMath StoChastic Trader
Pairs: EURUSD, GBPUSD, EURJPY, USDCAD, USDCHF, USDJPY
TimeFrame: H1
Trading Strategy: Trend/Swing
Return/DD Ratio: 43.49
Small Drawn Down: 7.57 %
Profit Factor: 2.11
Deviation” $53.59
Wins/Losses Ratio: 2.13
EA features:
-
EA Auto Installer
-
Matatrader 4 Platform
-
User Manual
-
Friendly EA Setting
-
Money Management Function
-
Works with all build +600
-
Life time update
-
Free setting for other pairs
What is Stochastic Oscillator?
Developed by George C. Lane in the late 1950s, the Stochastic Oscillator is a momentum indicator that shows the location of the close relative to the high-low range over a set number of periods. According to an interview with Lane, the Stochastic Oscillator “doesn’t follow price, it doesn’t follow volume or anything like that. It follows the speed or the momentum of price. As a rule, the momentum changes direction before price.” As such, bullish and bearish divergences in the Stochastic Oscillator can be used to foreshadow reversals. This was the first, and most important, signal that Lane identified. Lane also used this oscillator to identify bull and bear set-ups to anticipate a future reversal. Because the Stochastic Oscillator is range bound, is also useful for identifying overbought and oversold levels.
%K = (Current Close - Lowest Low)/(Highest High - Lowest Low) * 100
%D = 3-day SMA of %K

Lowest Low = lowest low for the look-back period
Highest High = highest high for the look-back period
%K is multiplied by 100 to move the decimal point two places
How is trades FxMath Stochastic Trdaer?
This strategy is using only Stochastic Indicator for Enter/Exit . Strategy compares different stochastic values to find major trends in market. Exit is based on stochastic indicator and finds the end of trend by comparing two stochastic values.
Advantage using several strategies in one account:
-
Control drawn down and reduce that
-
Making continuous profit
-
Safe trading due using different pairs
-
Safe trading due using different strategies
-
Control account free margin
-
Smaller standard division of profit
Price: 199 USD
EA Analyzer Portfolio Report
Portfolio
Total Profit $ 19402.14
Profit in pips 19859.88 pips
Yearly Avg profit $ 7055.32
# of trades 1446
Sharpe ratio 0.25
Profit factor 2.11
Return / DD ratio 43.49
Winning % 68.05 %
Drawdown $ 446.12
% Drawdown 7.57 %
Daily Avg profit $ 18.8
Monthly Avg profit $ 587.94
Average trade $ 37.61
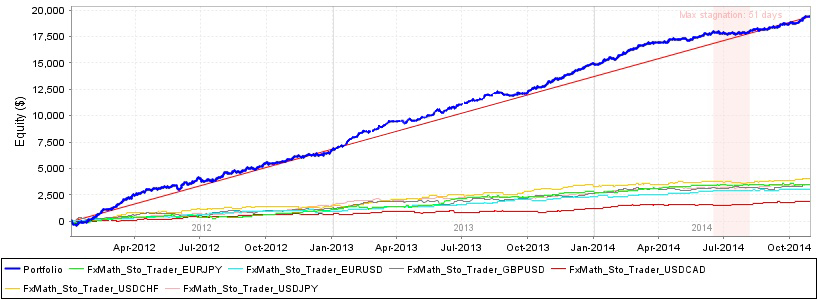
Strategies in portfolio
| # | Name | Symbol | Timeframe | Net Profit ($) | Net Profit (pips) | # of Trades | Sharpe Ratio | Profit Factor |
| S1 | FxMath_Sto_Trader_EURJPY | EURJPY | H1 | $ 3522.92 | 4022.9 pips | 267 | 0.24 | 2.02 |
| S2 | FxMath_Sto_Trader_EURUSD | EURUSD | H1 | $ 3003.1 | 3043.8 pips | 198 | 0.43 | 3.03 |
| S3 | FxMath_Sto_Trader_GBPUSD | GBPUSD | H1 | $ 3459.48 | 3581.71 pips | 203 | 0.25 | 1.86 |
| S4 | FxMath_Sto_Trader_USDCAD | USDCAD | H1 | $ 1884.94 | 2134.1 pips | 266 | 0.22 | 1.84 |
| S5 | FxMath_Sto_Trader_USDCHF | USDCHF | H1 | $ 4074.67 | 3845.5 pips | 284 | 0.22 | 2.05 |
| S6 | FxMath_Sto_Trader_USDJPY | USDJPY | H1 | $ 3457.02 | 3231.91 pips | 228 | 0.36 | 2.41 |
| # | Name | Return / DD Ratio | Winning % | Drawdown | % Drawdown | Yearly avg. profit | Monthly avg. profit | Daily avg. profit |
| S2 | FxMath_Sto_Trader_EURUSD | 12.74 | 80.3 % | $ 235.7 | 11.6 % | $ 1092.04 | $ 91 | $ 2.95 |
| S4 | FxMath_Sto_Trader_USDCAD | 10.15 | 63.16 % | $ 185.67 | 14.18 % | $ 685.43 | $ 57.12 | $ 1.84 |
| S6 | FxMath_Sto_Trader_USDJPY | 9.69 | 63.6 % | $ 356.75 | 11.6 % | $ 1257.1 | $ 104.76 | $ 3.37 |
Monthly Performance ($)
| Year | Jan | Feb | Mar | Apr | May | Jun | Jul | Aug | Sep | Oct | Nov | Dec | YTD |
| 2014 | 398.3 | 1059.54 | 513.43 | 342.83 | 278.31 | 280.22 | 74.71 | 245.66 | 550.37 | 721.68 | 0 | 0 | 4465.05 |
| 2013 | 1259.49 | 631.17 | 847.97 | 168.72 | 900.68 | 560.02 | 616.16 | 322.95 | 215.47 | 1052.97 | 672.29 | 1000.75 | 8248.64 |
| 2012 | 150.18 | 1071.63 | 1255.49 | 640.53 | -138.79 | 1025.13 | 223.93 | 614.97 | 632.37 | 392.91 | 445.21 | 374.88 | 6688.44 |
Stats
Strategy
| Wins/Losses Ratio | 2.13 | Payout Ratio (Avg Win/Loss) | 0.99 | Average # of Bars in Trade | 0 |
| AHPR | 0.1 | Z-Score | -2.2 | Z-Probability | 98.59 % |
| Expectancy | 13.42 | Deviation | $ 53.59 | Exposure | 0 % |
| Stagnation in Days | 51 | Stagnation in % | 4.94 % |
Trades
| # of Wins | 984 | # of Losses | 462 | ||||
| Gross Profit | $ 36889.78 | Gross Loss | $ -17487.64 | Average Win | $ 37.49 | Average Loss | $ -37.85 |
| Largest Win | $ 176.2 | Largest Loss | $ -215.84 | Max Consec Wins | 13 | Max Consec Losses | 6 |
| Avg Consec Wins | 3.31 | Avg Consec Loss | 1.56 | Avg # of Bars in Wins | 0 | Avg # of Bars in Losses | 0 |
Charts
Click on the chart to see bigger image
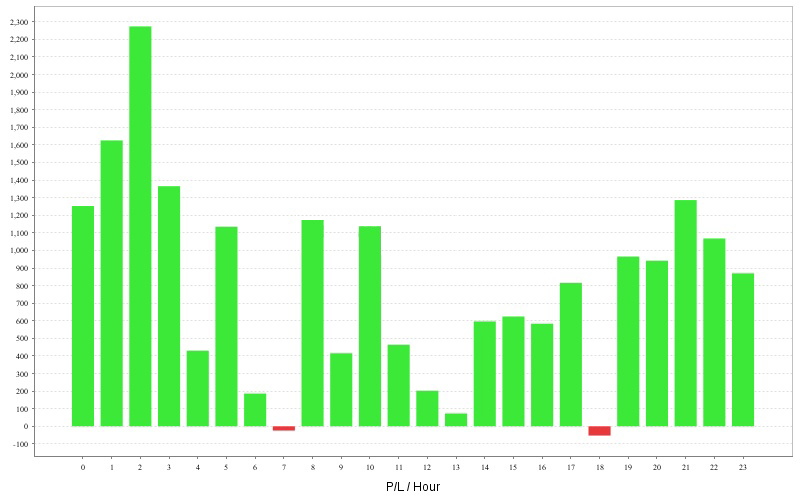 P/L by hour P/L by hour |
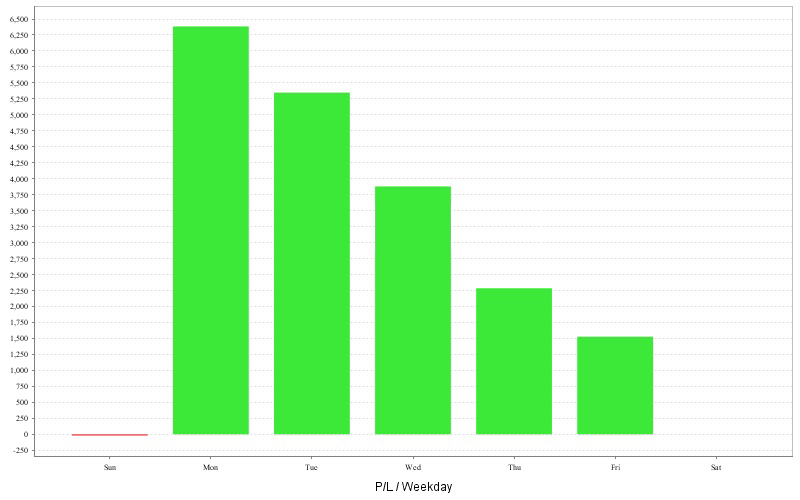 P/L by weekday P/L by weekday |
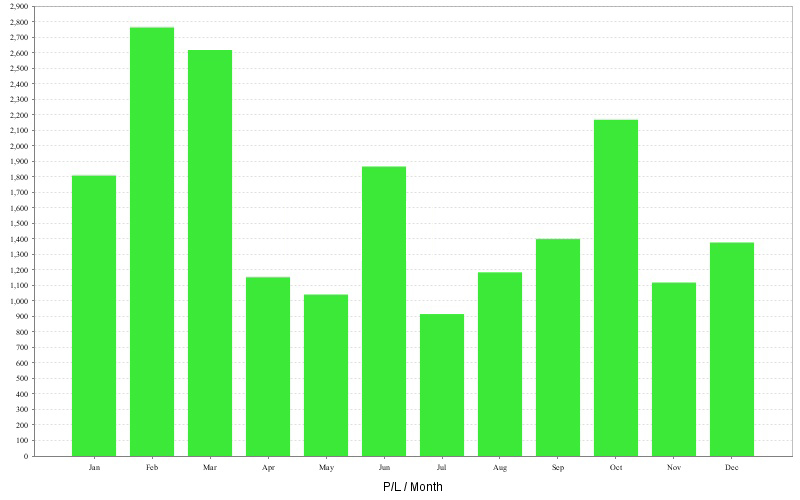 P/L by month P/L by month |
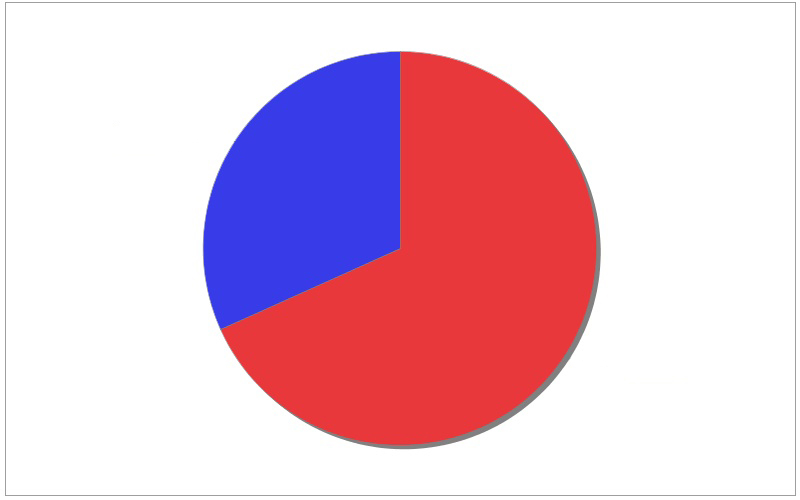 Long vs Short trades Long vs Short trades |
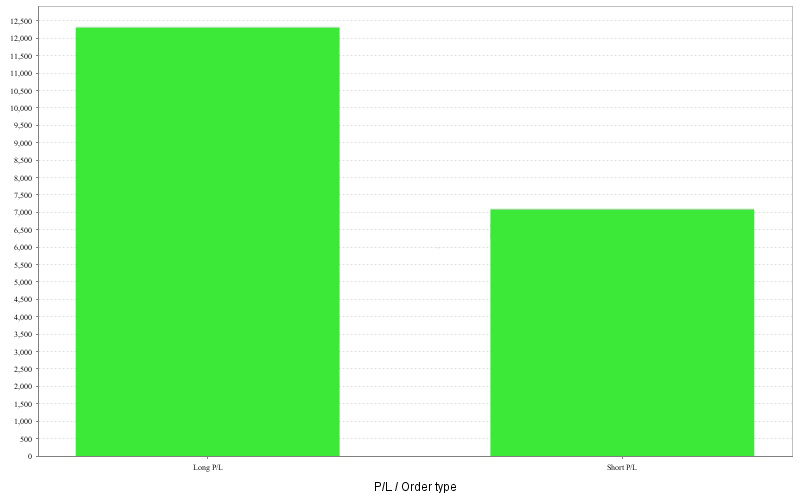 Long vs Short P/L Long vs Short P/L |
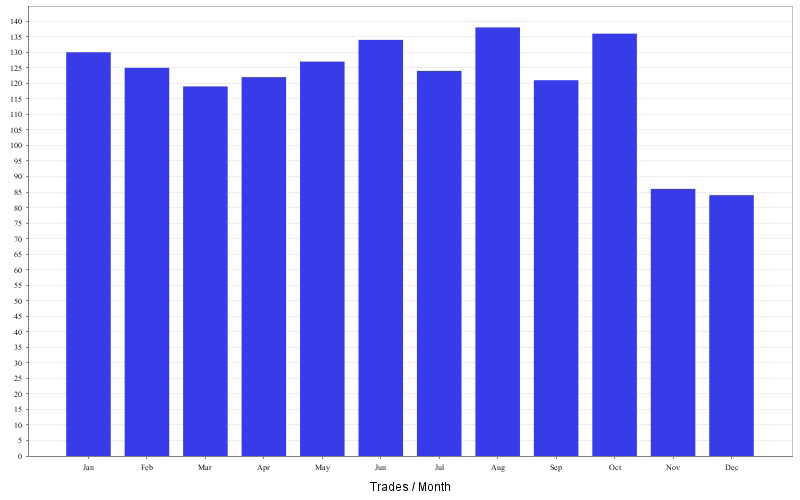 Trades by month Trades by month |
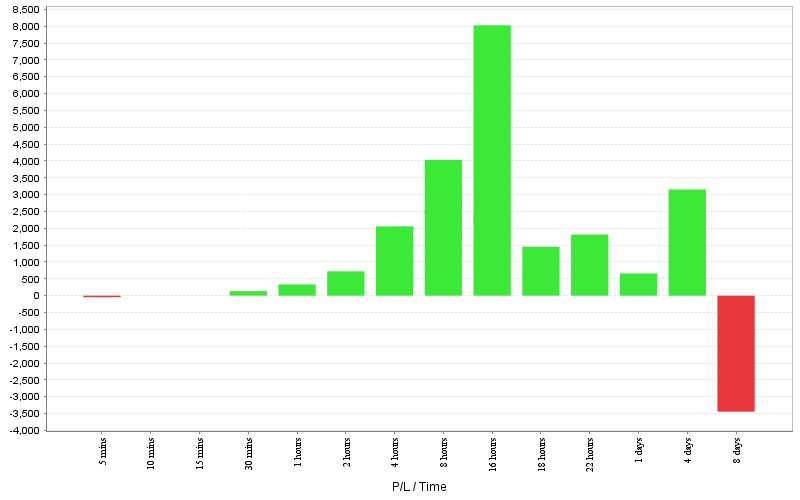 P/L by trade duration P/L by trade duration |
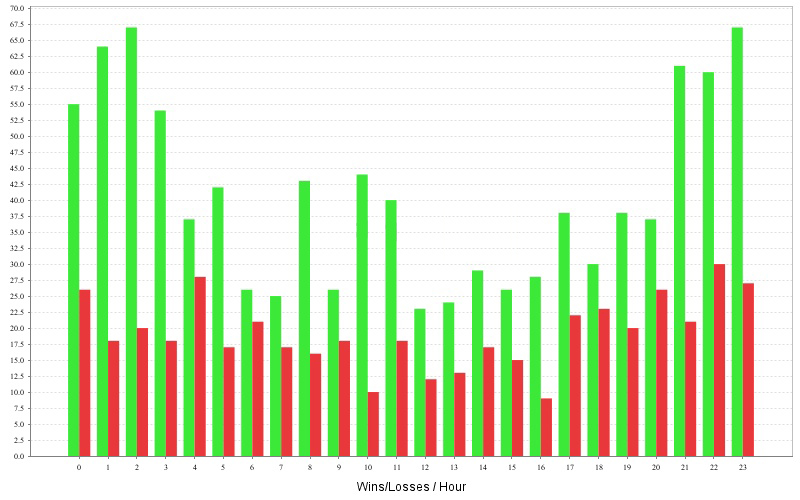 Wins/Losses by hour Wins/Losses by hour |
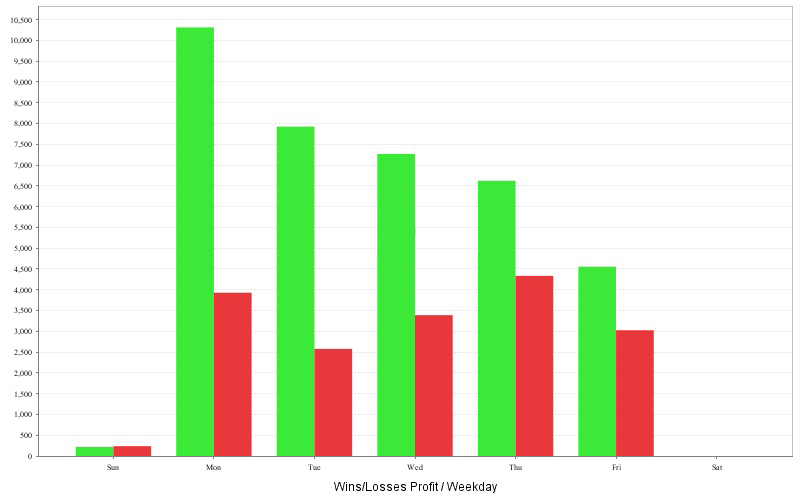 Wins/Losses Profit by weekday Wins/Losses Profit by weekday |
![]()
30 DAY MONEY BACK GUARANTEE
In the event we are unable to accord you product support or we are unable to fix a bug in the software within a reasonable time, you are entitled to our 30-day, no-hassle money-back guarantee. Your account will be credited promptly.
You are also entitled to a 12 Months Performance guarantee. What does this mean? If metaquotes were to do some changes like they did with build 600. You are entitled to a free update within one year from your date of purchase.
Price: 199 USD