FxMath Financial Solution
FxMath Aurum ML This Month: +17,581.4 Pips on Gold Across 532 Trades — 289 Losing Trades and Still Up
17 September 2026 · Monthly Review · XAUUSD · M5 · M15 · H1 · H2
FxMath Aurum ML closed 532 trades on Gold this month for +$1,758.14 — +17,581.4 pips. The number worth pausing on is this: 289 of those 532 trades lost money. More losers than winners, and the month is still well in profit.
The full 532-trade month · how four independent books divide the work · why a 45.7% win rate makes money · the 166-trade week and today's session · and the one book that lost money.
1. The Full Month
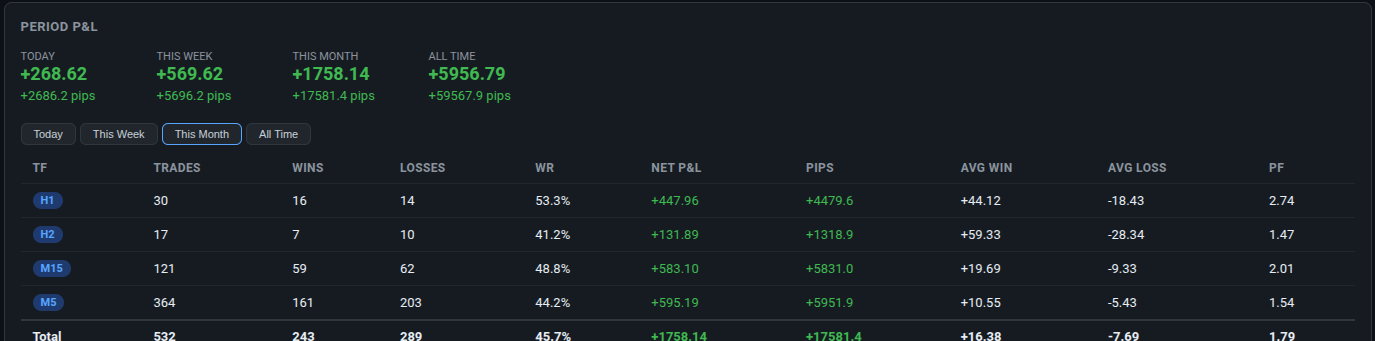
| TF | Trades | W | L | WR | Net P&L | Pips | Avg Win | Avg Loss | PF |
|---|---|---|---|---|---|---|---|---|---|
| H1 | 30 | 16 | 14 | 53.3% | +$447.96 | +$4,479.60 | +$44.12 | -$18.43 | 2.74 |
| H2 | 17 | 7 | 10 | 41.2% | +$131.89 | +$1,318.90 | +$59.33 | -$28.34 | 1.47 |
| M15 | 121 | 59 | 62 | 48.8% | +$583.10 | +$5,831.00 | +$19.69 | -$9.33 | 2.01 |
| M5 | 364 | 161 | 203 | 44.2% | +$595.19 | +$5,951.90 | +$10.55 | -$5.43 | 1.54 |
| Total | 532 | 243 | 289 | 45.7% | +$1,758.14 | +17,581.4 | +$16.38 | -$7.69 | 1.79 |
2. Four Books, Four Different Jobs
The system runs four timeframes as independent books, each with its own analysis and risk management. None of them needs the others to win, and that is visible in how differently they trade.
| Book | Trades | WR | Net P&L | Net Pips | Avg Win | Avg Loss | PF |
|---|---|---|---|---|---|---|---|
| H1 | 30 | 53.3% | +$447.96 | +$4,479.60 | +$44.12 | -$18.43 | 2.74 |
| H2 | 17 | 41.2% | +$131.89 | +$1,318.90 | +$59.33 | -$28.34 | 1.47 |
| M15 | 121 | 48.8% | +$583.10 | +$5,831.00 | +$19.69 | -$9.33 | 2.01 |
| M5 | 364 | 44.2% | +$595.19 | +$5,951.90 | +$10.55 | -$5.43 | 1.54 |
- M5 is the volume engine: 364 trades, more than the other three books combined, at a modest 44.2% win rate.
- M15 is the efficient one: +5,831.0 pips from 121 trades, roughly a third of M5's count.
- H1 is the selective one: 30 trades and the best profit factor of the four, 2.74. It waits for its setup.
- H2 is the smallest book, 17 trades, and still contributed +1,318.9 pips.
3. Why a 45.7% Win Rate Makes Money
This is the part that is easy to misread. A win rate below 50% sounds like a losing system. It is not, and the reason has nothing to do with the win rate.
Winners run 2.13× the size of losers. That single fact sets the win rate the system must clear to break even: 100 / (1 + 2.13) = 31.9%. Over 532 trades it delivered 45.7% — a margin of 13.8 points.
Put the other way: this system can lose 289 trades in a month and still finish +17,581.4 pips up. The win rate describes how often it is right. The payoff ratio describes how much it makes when it is.
4. The Same Pattern at Every Sample Size
Line up today, this week and this month. The win rate is the least stable number in the table, and the payoff ratio is the most stable. That is the opposite of what most people expect.
| Period | Win Rate | Avg Win | Avg Loss | W/L Ratio | Break-even WR | Margin |
|---|---|---|---|---|---|---|
| Today | 64.5% | +$17.91 | -$8.15 | 2.20 | 31.3% | +33.2 pts |
| This week | 46.4% | +$16.00 | -$7.44 | 2.15 | 31.7% | +14.7 pts |
| This month | 45.7% | +$16.38 | -$7.69 | 2.13 | 31.9% | +13.8 pts |
The win rate falls 18.8 points from the 31-trade daily view to the 532-trade monthly view, while the win/loss ratio moves 0.07. A short sample flatters the win rate. The larger the sample, the closer it settles to the true figure the system actually runs at — and the ratio barely notices.
5. This Week — 166 Trades
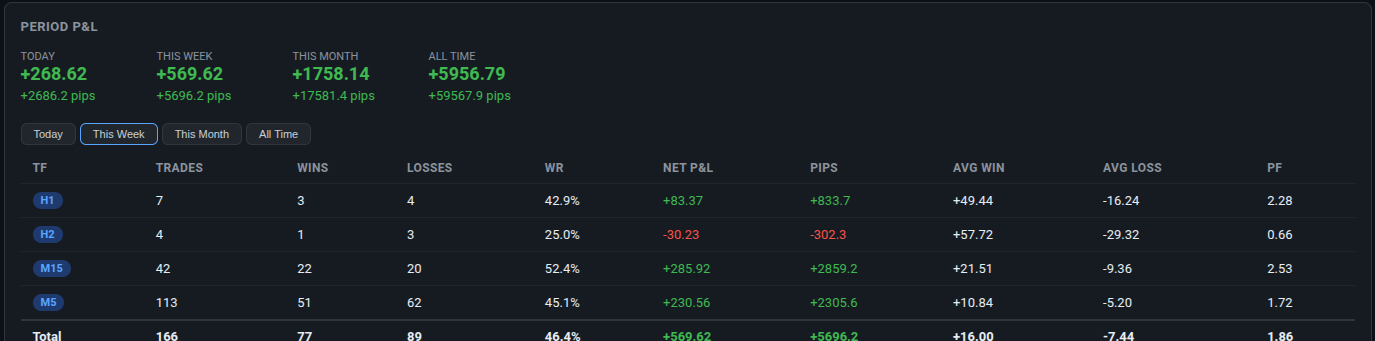
| TF | Trades | W | L | WR | Net P&L | Pips | Avg Win | Avg Loss | PF |
|---|---|---|---|---|---|---|---|---|---|
| H1 | 7 | 3 | 4 | 42.9% | +$83.37 | +$833.70 | +$49.44 | -$16.24 | 2.28 |
| H2 | 4 | 1 | 3 | 25.0% | -$30.23 | -$302.30 | +$57.72 | -$29.32 | 0.66 |
| M15 | 42 | 22 | 20 | 52.4% | +$285.92 | +$2,859.20 | +$21.51 | -$9.36 | 2.53 |
| M5 | 113 | 51 | 62 | 45.1% | +$230.56 | +$2,305.60 | +$10.84 | -$5.20 | 1.72 |
| Total | 166 | 77 | 89 | 46.4% | +$569.62 | +5,696.2 | +$16.00 | -$7.44 | 1.86 |
6. Today — 31 Trades, +2,686.2 Pips
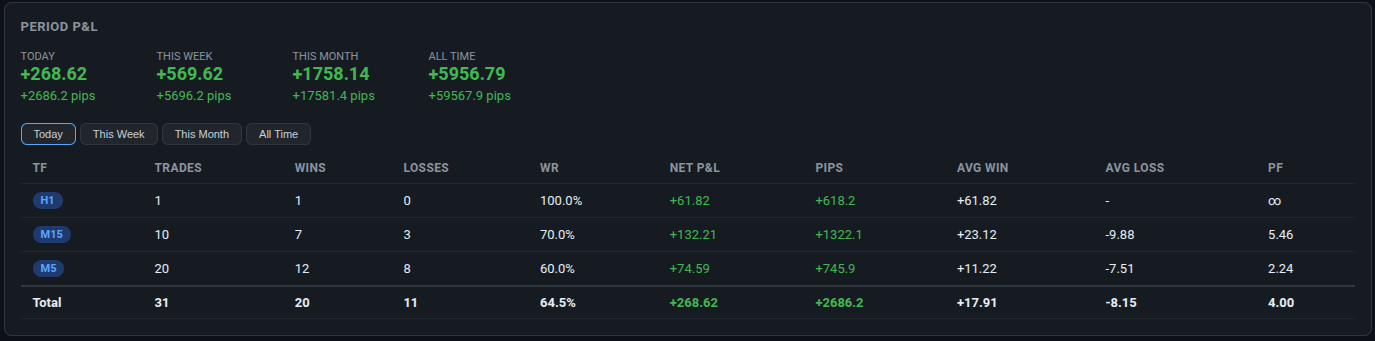
| TF | Trades | W | L | WR | Net P&L | Pips | Avg Win | Avg Loss | PF |
|---|---|---|---|---|---|---|---|---|---|
| H1 | 1 | 1 | 0 | 100.0% | +$61.82 | +$618.20 | +$61.82 | – | ∞ |
| M15 | 10 | 7 | 3 | 70.0% | +$132.21 | +$1,322.10 | +$23.12 | -$9.88 | 5.46 |
| M5 | 20 | 12 | 8 | 60.0% | +$74.59 | +$745.90 | +$11.22 | -$7.51 | 2.24 |
| Total | 31 | 20 | 11 | 64.5% | +$268.62 | +2,686.2 | +$17.91 | -$8.15 | 4.00 |
7. The Line We Do Not Hide
This week, one of the four books lost money. It belongs in the post.
- Why it happens. Independent books will disagree. If every timeframe won every week they would not be independent — they would be one trade counted four times.
- Why it is survivable. The other three books carried the week to +$569.62 on their own. No single timeframe decides the outcome.
- It stays in the published record rather than being filtered out of it. That is the standard this dashboard is held to.
8. Cumulative and All-Time
| Period | Net P&L | Net Pips |
|---|---|---|
| Today | +$268.62 | +2,686.2 |
| This Week | +$569.62 | +5,696.2 |
| This Month | +$1,758.14 | +17,581.4 |
| All Time | +$5,956.79 | +59,567.9 |
Today is 47% of the week and the week is 32% of the month. All-time stands at +59,567.9 pips — roughly 3.4 months at the current pace, accumulated and held.
A 47.4% all-time win rate is a losing rate on a coin-flip framing. The system is profitable anyway because winners run about 2.13× the size of losers — the same fact the 532-trade month above demonstrates, and the only reason any of these numbers are positive.
9. How FxMath Aurum ML Works
A master EA generates the signals; slave EAs execute them on your terminals. Currently live on M5, M15, H1 and H2, each timeframe analysing and managing risk independently.
- Choose a plan and complete your crypto payment.
- Register your MT4/MT5 account at copier.fxmath.net/client.
- Install the Master EA and your Slave EA — the license activates automatically.
- Monitor on the live dashboard, with a Telegram alert on every trade.
Risk design — one trade at a time
- Each timeframe opens one position, waits for SL or TP, then evaluates the next entry.
- No averaging down, no martingale, no grid — 100% FIFO-compatible for US brokers.
- Three SL/TP modes: signal, fixed pips, or ATR-based with configurable multipliers.
- A 1:2 risk-to-reward target means only a 35% win rate is needed to break even. As the 532-trade month shows, the system runs well above that.
- Works from a small deposit — you can start as low as $50–100 and scale up.
10. Pricing & Payment
Same system on every plan — only the duration differs. Each license covers one MT4 or MT5 account with all available timeframes. The live dashboard and the Telegram channel are free for everyone, no license required.
Pay at the secure checkout above, or contact @FxMath on Telegram to upgrade an existing plan (the difference is prorated) or email [email protected].
11. See It Live Before You Buy
There is no demo and no trial, because there does not need to be one. The free dashboard and the Telegram channel are the real thing — watch every trade open and close in real time, with no license required.
Tags
FxMathAurum MLMonthly ResultsXAUUSDGoldMulti-TimeframeAlgorithmic TradingForexTrade CopierMT5
Discover more from FxMath Financial Solution
Subscribe to get the latest posts sent to your email.