5 Harmonic Patterns — November 2, 2026
Generated by FxMath Harmonic Hunter MT5 —
3 bearish, 2 bullish, all H1. Geometry accuracy 81%–97%,
ML-confirmed 3 of 5.
3 sell · 2 buy
Best: CADCHF 97.0%
Score ≥ 90%
Trend · RSI · S/R
⚠️ Read the verdicts before the accuracy score
All five setups cleared the RSI guard — 28.5, 28.6, 77.9, 73.7 and 72.2, every one a
genuine momentum extreme. All five failed the trend guard, and all five also failed
support / resistance. Price sat on the wrong side of the EMA50 for its direction and every
D point stood mid-range rather than at structure.
That is the signature of a wide-range market: textbook geometry, wrong location. The ML score is the
real tie-breaker in this set — 100% on EURJPY and AUDCHF, 94% on CADCHF,
against 0% on EURAUD and 13% on GBPJPY.
🎯 Key Execution Levels
📐 Fibonacci Geometry
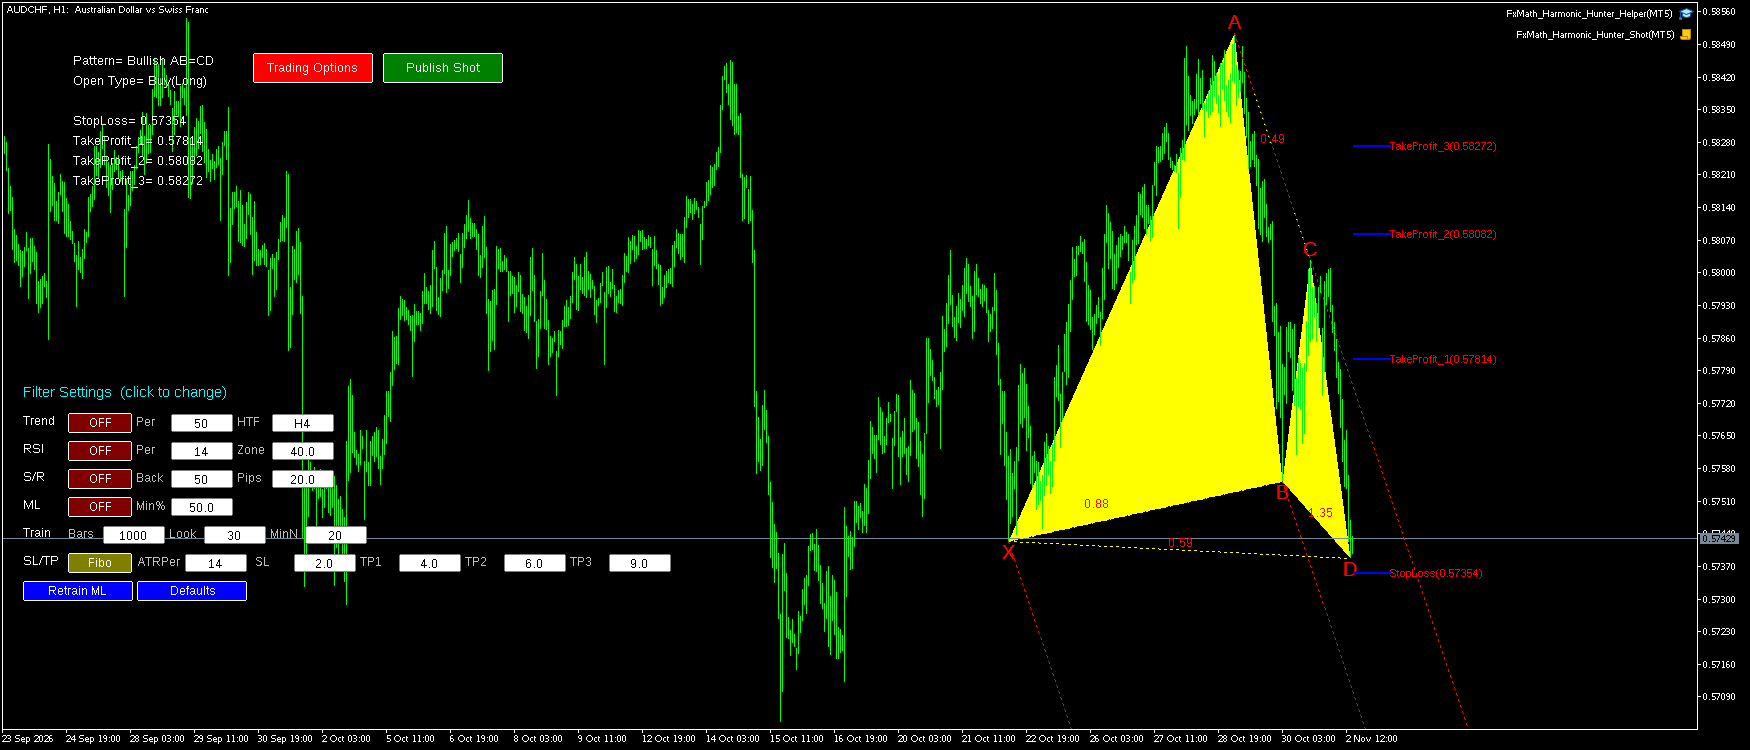
Reading: Freshest setup of the day — D printed one bar ago, so the reversal has barely started. Geometry is the loosest at 83%, with XAB 0.881 at the top of the 0.786–0.886 band. What lifts it is the ML read of 100% plus a genuinely oversold RSI of 28.5. The 10.8-pip stop is tight, so expect the occasional wick-out.
🎯 Key Execution Levels
📐 Fibonacci Geometry
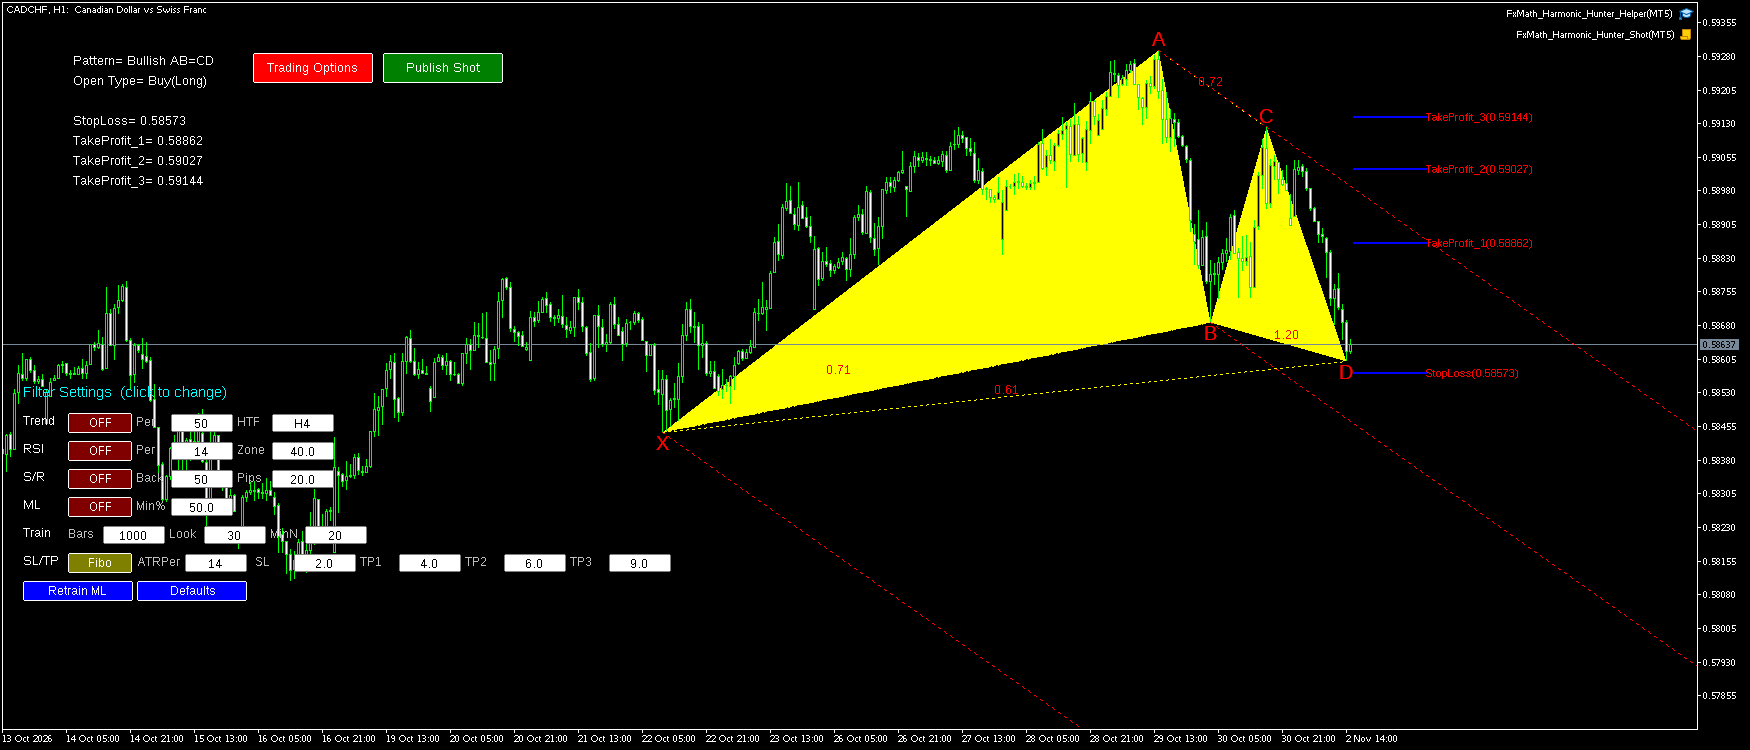
Reading: Best geometry of the day at 97%, and not close — XAB 0.711, ABC 0.719, BCD 1.202 and XAD 0.615 all sit inside their textbook windows. It shares its X point and D bar with AUDCHF, so this is a franc story, not two unrelated signals. The 8.8-pip stop is the tightest of the day and the real risk here.
🎯 Key Execution Levels
📐 Fibonacci Geometry
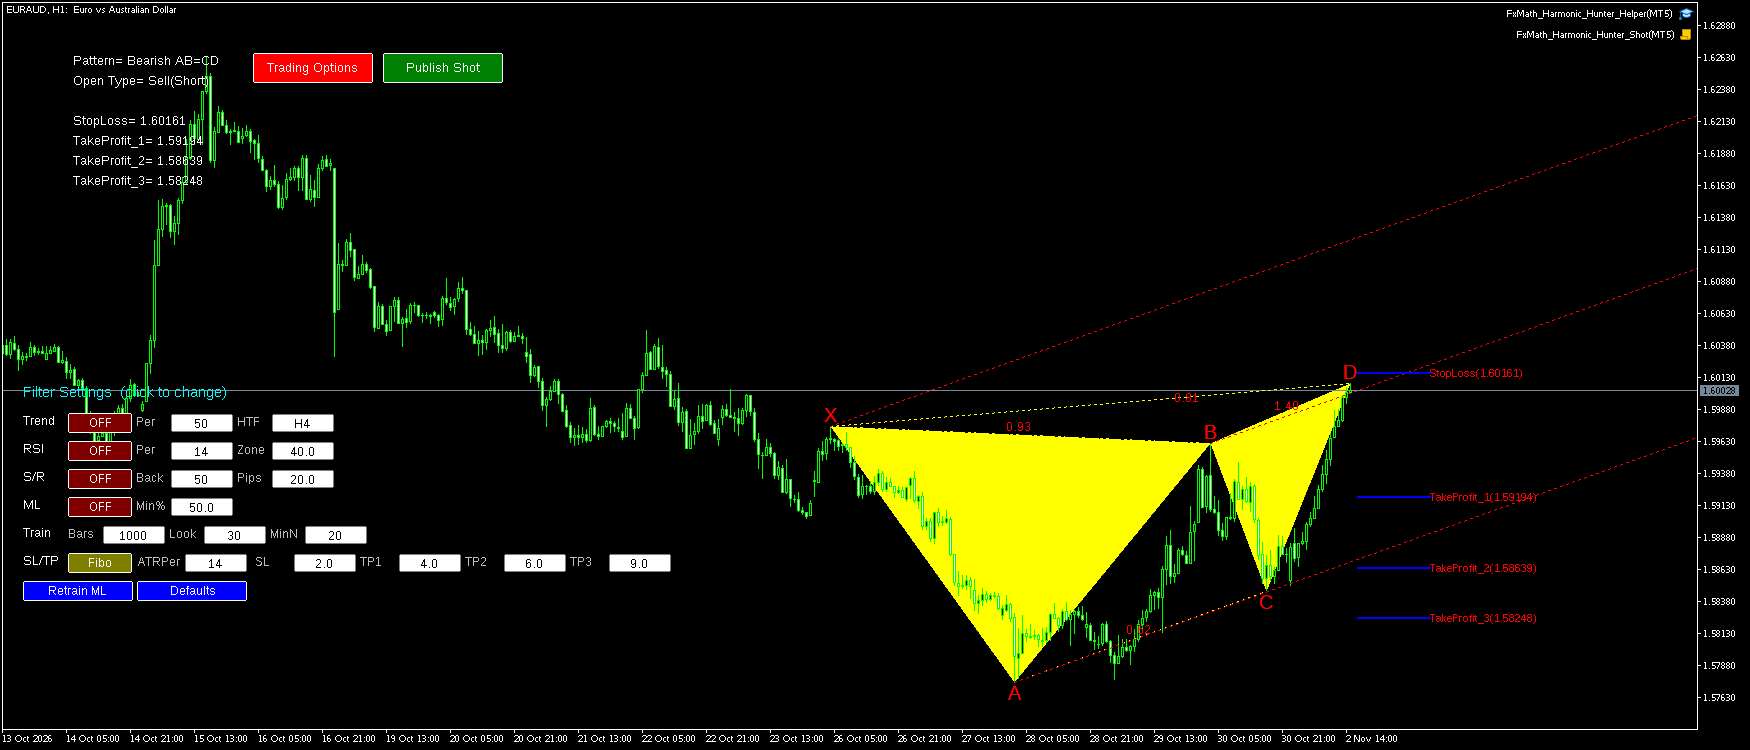
Reading: The one to be careful with. ML 0% means the model has seen this shape on this chart before and it did not reach TP1 — the strongest single negative the EA can print. Geometry is weakest at 81%, with XAB 0.933 past the 0.886 ceiling and XAD 0.812 well beyond target, which usually reads as momentum rather than exhaustion.
🎯 Key Execution Levels
📐 Fibonacci Geometry
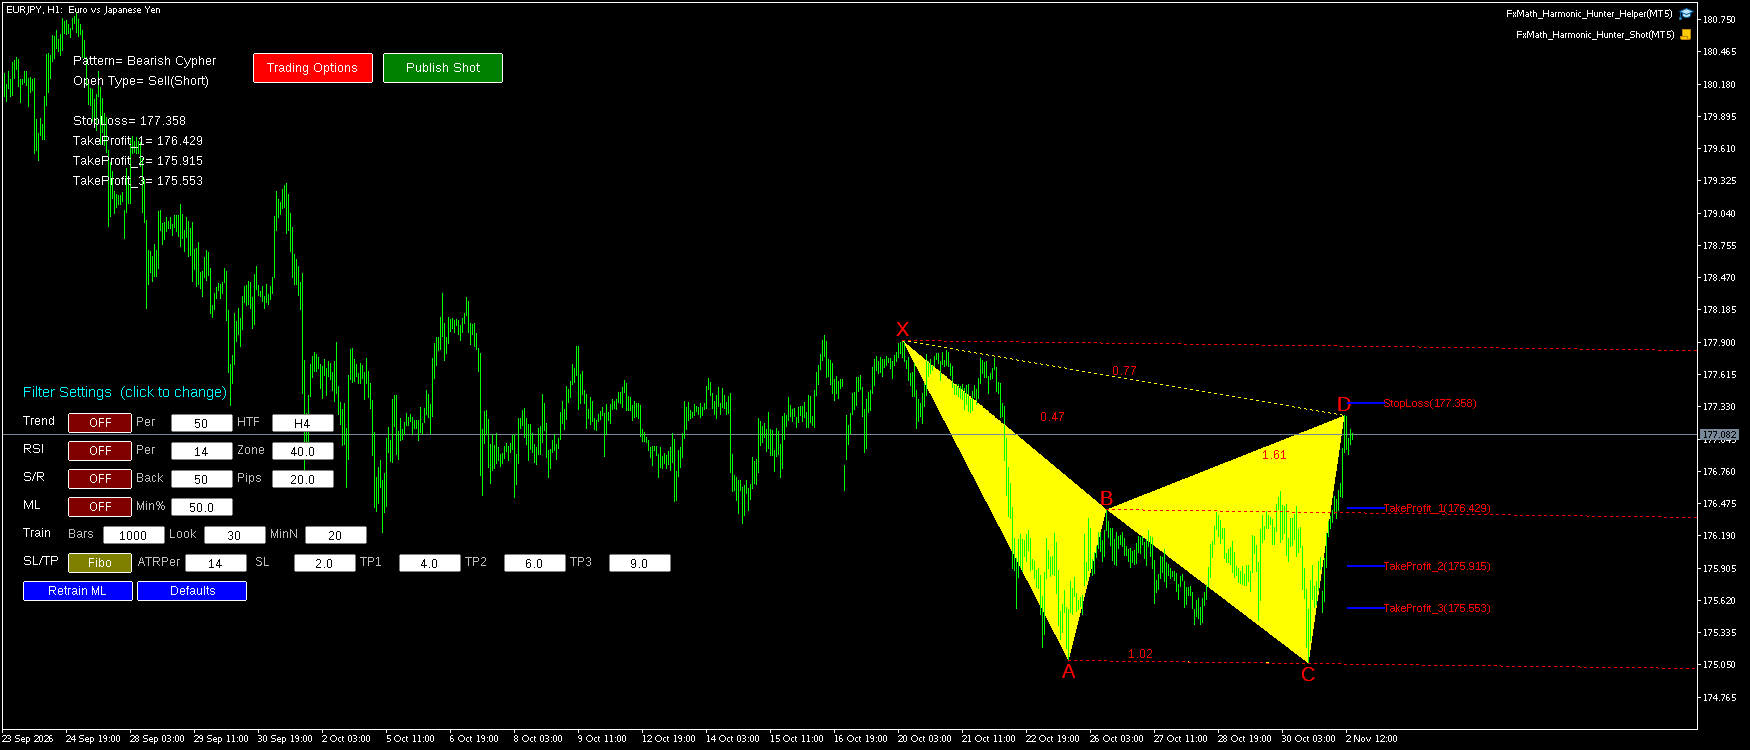
Reading: Most compelling single line in the list. Cypher has a precise signature — B beyond X (ABC 1.020), D in the 0.786 zone (XAD 0.774) — and both land almost exactly. RSI 73.7 overbought, 110 pips above the EMA50, ML 100%. The catch is the entry: D is four bars old and TP1 offers only 1:1.52.
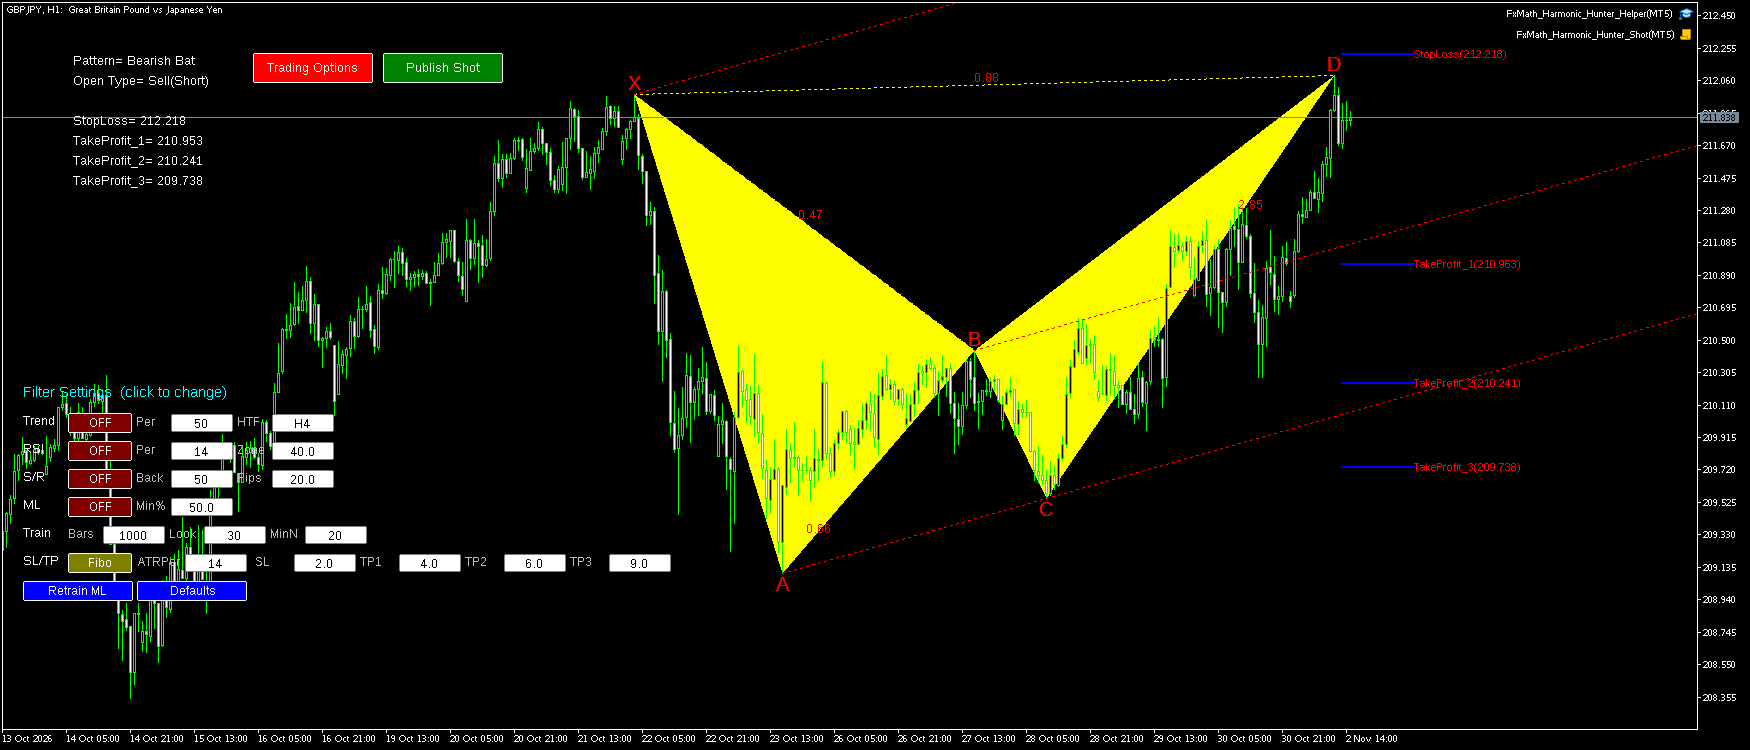
🎯 Key Execution Levels
📐 Fibonacci Geometry
Reading: A textbook Bat on the ratios — XAB 0.467 inside 0.382–0.5 and XAD 0.884 at the 0.886 zone — with a slightly extended BCD at 2.851. What knocks it down is ML 13%: the model is not interested. Combined with a four-bar-old D point and 1:1.94 to TP1, this is the skip of the set.
How the Harmonic Hunter finds these
30 pairs × 18 timeframes — pure MQL5, no external indicators, no DLL
FxMath Harmonic Hunter
Risk disclaimer: Pattern accuracy grades Fibonacci geometry —
how cleanly the swing points sit on the pattern’s textbook ratios — not a win rate, and not a
probability of profit. The ML percentage is a model estimate of TP1 probability on that chart’s own
history. Trading forex and CFDs on margin carries a high level of risk and may not be suitable for all
investors. Past performance is not indicative of future results. Nothing here is financial advice.
Discover more from FxMath Financial Solution
Subscribe to get the latest posts sent to your email.