FxMath Financial Solution
FxMath Aurum ML — October 2026 Review: +6,588 Pips on Gold, and the Hours That Actually Pay
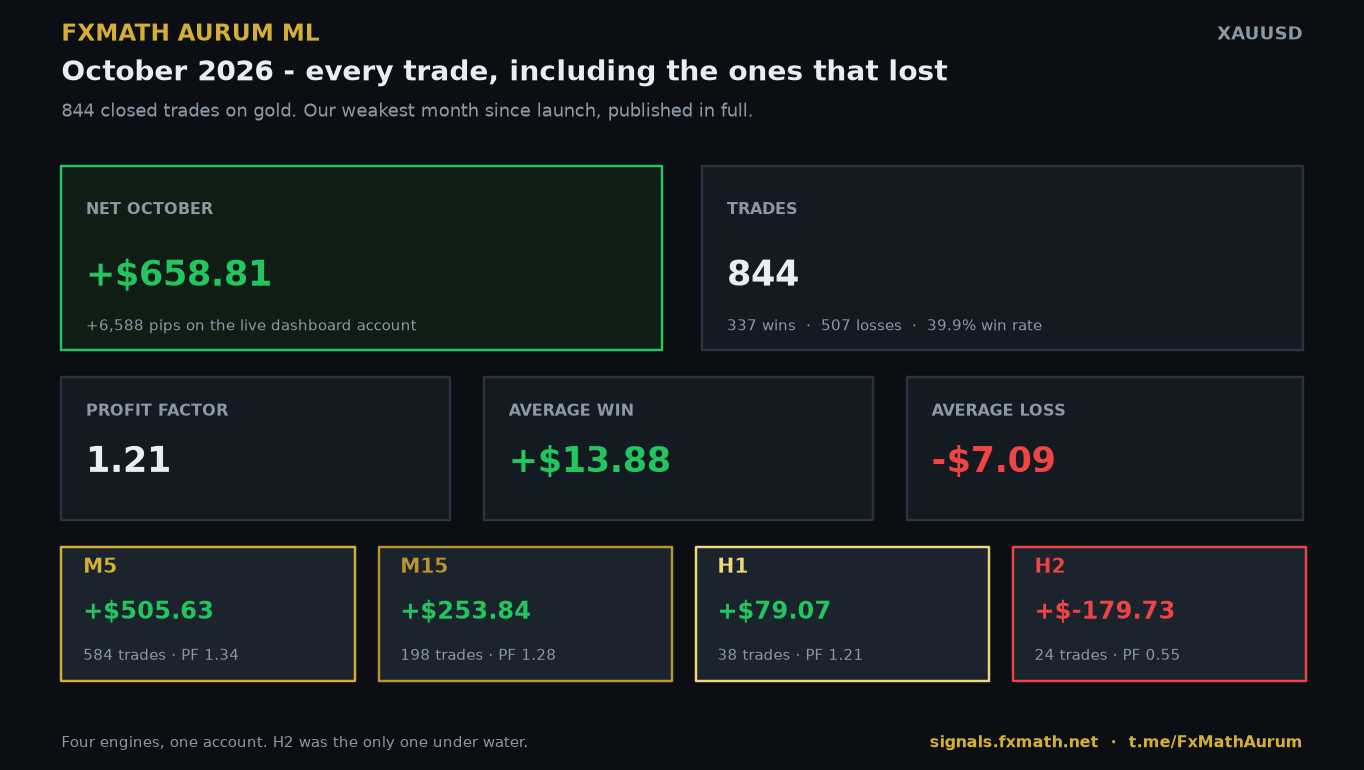
October was our weakest month since launch — and we are publishing it in full. 844 closed trades on Gold produced +6,588 pips (+$658.81 at 0.01 lot) with a 39.9% win rate and a profit factor of 1.21. Then we cut all 3,378 trades on the public dashboard by the hour the signal fired, and found something far more useful than the monthly total.
844 trades · 337W / 507L · 39.9% win rate · +6,588 pips (+$658.81) · Profit Factor 1.21
Best engine: M5 (+$505.63, PF 1.34) · Only losing engine: H2 (−$179.73, PF 0.55)
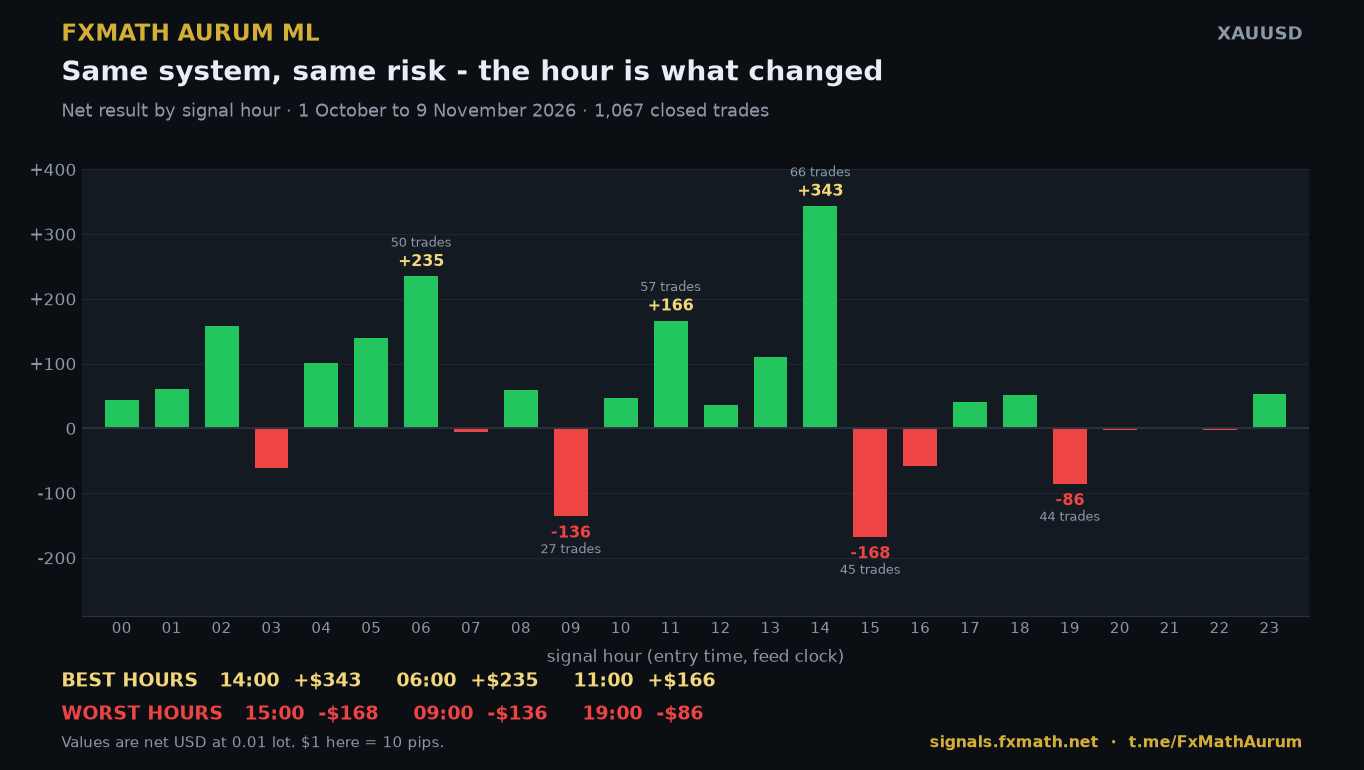
Best signal hours: 14:00 (+$343), 06:00 (+$235), 11:00 (+$166) · Worst: 15:00 (−$168), 09:00 (−$136), 19:00 (−$86)
October at a Glance
Average winner was +$13.88 against an average loser of −$7.09 — winners ran almost exactly twice as far as losers. At a 1:2 risk-to-reward ratio a system only needs one win in three to break even, which is why a month with 39.9% accuracy still printed green.
Performance by Timeframe
Four engines ran independently on the same account. Three finished green; the slowest one did not.
| TF | Trades | Wins | Losses | Win Rate | Pips | Net P&L | Profit Factor |
|---|---|---|---|---|---|---|---|
| M5 | 584 | 240 | 344 | 41.1% | +5,056.3 | +$505.63 | 1.34 |
| M15 | 198 | 78 | 120 | 39.4% | +2,538.4 | +$253.84 | 1.28 |
| H1 | 38 | 14 | 24 | 36.8% | +790.7 | +$79.07 | 1.21 |
| H2 | 24 | 5 | 19 | 20.8% | −1,797.3 | −$179.73 | 0.55 |
| TOTAL | 844 | 337 | 507 | 39.9% | +6,588.1 | +$658.81 | 1.21 |
H2 traded the least and lost the most: its stop distance is the widest of the four engines, and October punished exactly that. Its failure is also the most informative result of the month, because it is a pure timing failure — every one of its losing hours fell in the afternoon block.
The Hour Is the Variable
Same signals, same stop logic, same lot size. The only thing that changed between a profitable hour and a losing hour was the clock. Cutting 1 October – 9 November 2026 into 1,067 closed trades by signal hour:
| Signal Hour | Trades | Win Rate | Net P&L | Pips | Profit Factor |
|---|---|---|---|---|---|
| 14:00 | 66 | 48% | +$343.34 | +3,433 | 2.28 |
| 06:00 | 50 | 52% | +$234.65 | +2,347 | 2.63 |
| 11:00 | 57 | 49% | +$166.07 | +1,661 | 2.28 |
| 02:00 | 44 | 50% | +$157.50 | +1,575 | 1.72 |
| 05:00 | 53 | 43% | +$138.75 | +1,388 | 1.98 |
| 13:00 | 73 | 45% | +$110.72 | +1,107 | 1.35 |
| 04:00 | 36 | 53% | +$101.63 | +1,016 | 1.59 |
| 15:00 | 45 | 24% | −$167.87 | −1,679 | 0.50 |
| 09:00 | 27 | 15% | −$135.96 | −1,360 | 0.34 |
| 19:00 | 44 | 34% | −$85.90 | −859 | 0.55 |
| 03:00 | 50 | 26% | −$62.03 | −620 | 0.76 |
| 16:00 | 39 | 28% | −$58.28 | −583 | 0.77 |
14:00 made +$343.34. 15:00, sixty minutes later, lost $167.87. The seven productive hours above contributed +$1,252; the five dead ones took back −$510. The edge is real — it is simply not distributed evenly across the trading day.
Hours are the signal hour recorded on the dashboard account, which runs on the broker clock (roughly UTC+2 — the feed shows the week opening at 22:00 and stopping at 19:00, with the daily rollover gap at 21:00).
Each Timeframe Has Its Own Clock
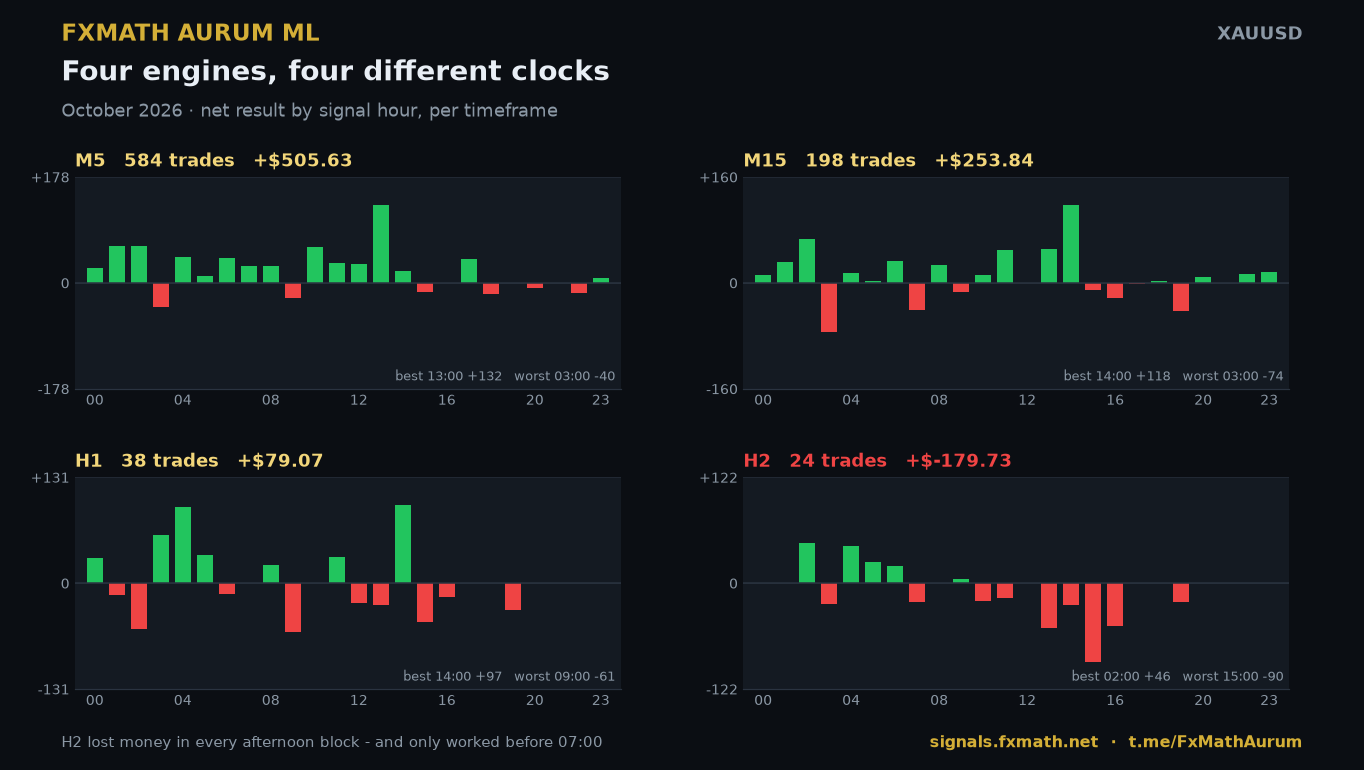
Splitting October by timeframe shows there is no single “best hour” for the system — there is a best hour per engine. Running all four on one shared clock is precisely why one of them bled for a month.
| TF | Best Hours (Net P&L) | Worst Hours (Net P&L) |
|---|---|---|
| M5 584 trades · +$505.63 |
13:00 +$131.84 (39 trades, 51%) · 01:00 +$62.10 · 02:00 +$61.79 · 10:00 +$60.81 | 03:00 −$39.99 · 09:00 −$25.34 · 18:00 −$19.05 |
| M15 198 trades · +$253.84 |
14:00 +$118.23 (16 trades, 56%) · 02:00 +$65.81 (60%) · 13:00 +$50.60 · 11:00 +$49.57 | 03:00 −$74.09 (12%) · 19:00 −$42.38 · 07:00 −$41.40 |
| H1 38 trades · +$79.07 |
14:00 +$96.76 (3 for 3) · 04:00 +$94.55 (3 of 4) · 03:00 +$59.12 | 09:00 −$60.51 (0 for 4) · 02:00 −$56.42 · 15:00 −$48.38 |
| H2 24 trades · −$179.73 |
02:00 +$46.35 · 04:00 +$43.39 · 05:00 +$24.47 · 06:00 +$20.33 — green only before 07:00 | 15:00 −$90.24 (0 for 4) · 13:00 −$51.25 · 16:00 −$49.08 |
M5 lives in the 10:00–14:00 block plus a 01:00–02:00 window. M15 and H1 both want 14:00 and very little else. H2 is a dawn-only engine that was allowed to trade the whole afternoon and paid for it.
October, Three Ways
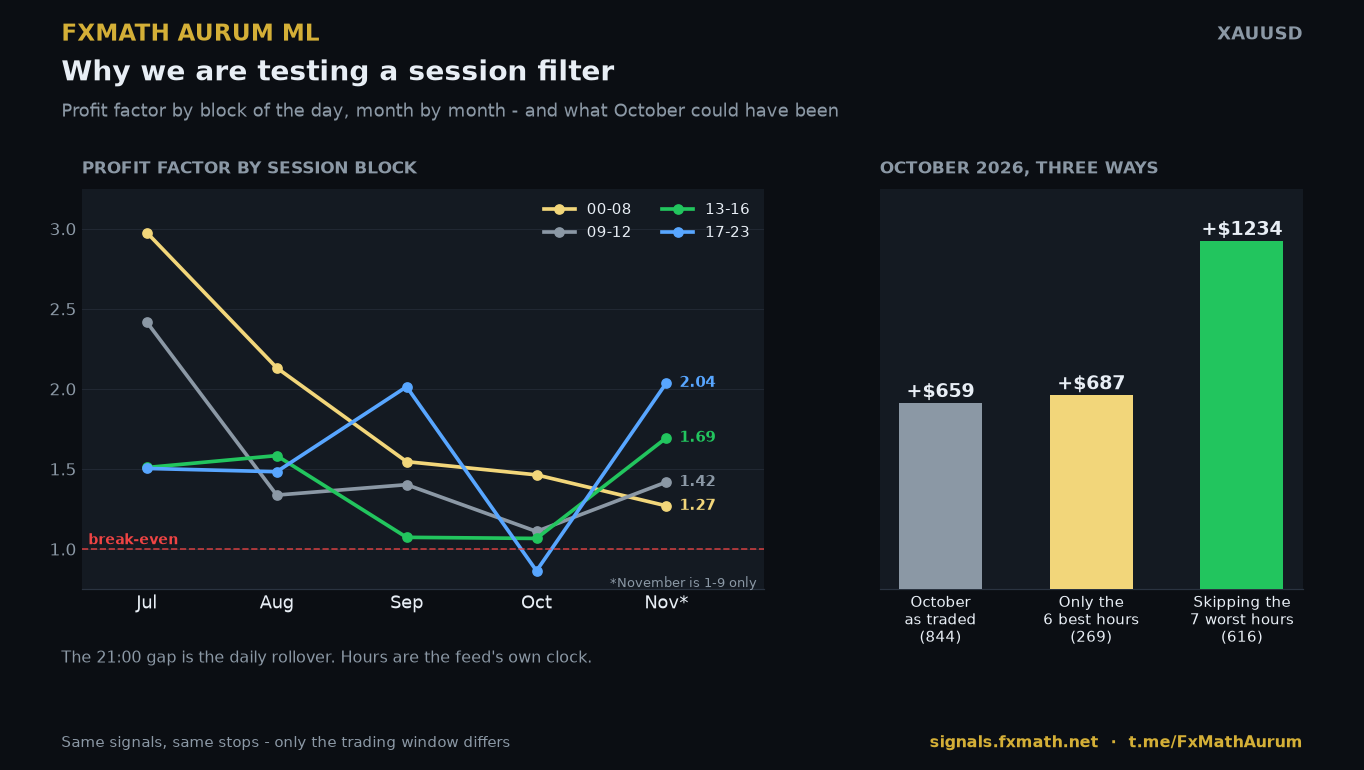
To test whether this is noise or structure, we re-ran October three ways on the same trade set — no changes to entries, stops or sizing, only to which hours were allowed to trade.
| October Variant | Trades | Win Rate | Net P&L | Profit Factor |
|---|---|---|---|---|
| As traded (all hours) | 844 | 39.9% | +$658.81 | 1.21 |
| Only the 6 best hours (02, 05, 06, 11, 13, 14) | 269 | 46.5% | +$686.65 | 1.72 |
| Skipping the 7 worst hours (03, 07, 09, 15, 16, 18, 19) | 616 | 45.0% | +$1,233.86 | 1.64 |
Read the second row twice: a third of the trades, more profit, and the win rate up from 39.9% to 46.5%. Read the third: those seven hours cost $579 in a single month — 88% of the profit we actually booked.
The block-by-block view explains why this needs to be per-timeframe rather than a single global switch. The 00:00–08:00 block has been profitable in every month since launch, but its profit factor has halved (2.98 → 2.13 → 1.55 → 1.46 → 1.27). The 17:00–23:00 block was the best block in September at PF 2.01 and the only losing block in October at PF 0.86. A fixed global window would have chased both moves backwards.
What We Do With This
Nothing is being changed silently. The EA already ships an advanced time filter with GMT or broker-time support, per-timeframe risk settings, minimum confidence thresholds and signal-age guards. The work now is to let each timeframe carry its own trading window instead of sharing one, and then forward-test it on the live account.
- M5 — the 10:00–14:00 block plus the 01:00–02:00 window
- M15 — concentrated around 14:00 and 11:00, closed during the 03:00 and 07:00 hours
- H1 — 03:00–05:00 and 14:00 only, with 09:00 excluded
- H2 — pre-07:00 only, or disabled until the forward test proves otherwise
When that test produces numbers, they will be published exactly like this one: trade by trade, losses included, on the public dashboard.
Full Transparency
Every number in this article came from the public trade feed behind signals.fxmath.net — 3,378 closed trades between 15 July and 9 November 2026. No cherry-picking, no demo account, no hidden losing days. Watch the same account live (it refreshes every 10 seconds) or follow the free Telegram channel t.me/FxMathAurum for alerts the moment a position opens or closes.
Method note: results are grouped by the hour the signal fired (entry hour), not the exit hour, because that is the hour a trading-time filter actually controls. Sizes on the dashboard account are fixed at 0.01 lot, so $1 of P&L equals 10 pips and all dollar figures scale linearly with position size.
Pricing & Payment
Same features on every plan — only the duration differs. Each license covers one MT4 or MT5 account with all timeframes. The live dashboard and Telegram alerts are free for everyone, no license required.
Pay directly at the secure checkout (fxmath.com/pay) or via the storefront. Need help choosing or upgrading? Contact @FxMath on Telegram or email [email protected]. Prefer to see results first? Watch live trades on the dashboard or the free Telegram channel before buying.
Tags
FxMathAurum MLMonthly ReviewXAUUSDGoldProfit FactorMachine LearningAlgorithmic TradingSession FilterTrade Copier
Discover more from FxMath Financial Solution
Subscribe to get the latest posts sent to your email.