FxMath Financial Solution
FxMath Aurum ML Live Results: +$1,821.40 This Month on Gold
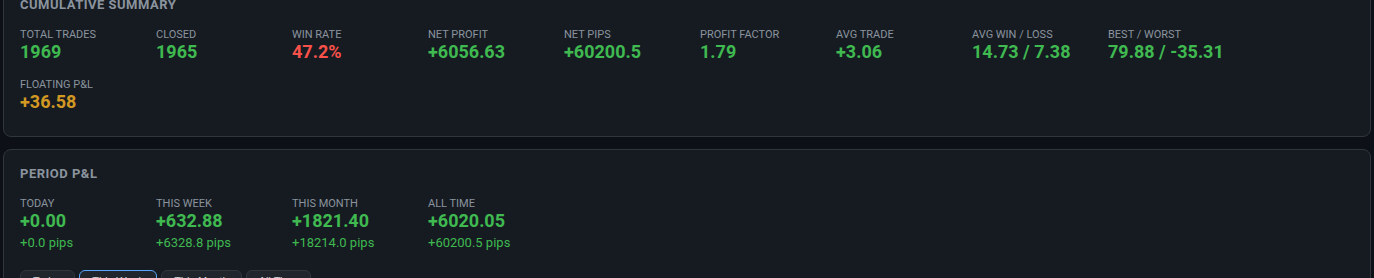
The FxMath Aurum ML multi-timeframe trade copier closed
1,965 trades since launch for a net profit of
+$6,020.05 (+60,200.5 pips) at a
47.2% win rate — and this month alone added
+$1,821.40 across 585 trades.
This Week: 219 trades · 45.2% win rate ·
+$632.88 (+6,328.8 pips) · Profit Factor 1.73
This Month: 585 trades · 45.3% win rate ·
+$1,821.40 (+18,214.0 pips) · Profit Factor 1.75
All Time: 1,965 trades · 47.2% win rate ·
+$6,020.05 (+60,200.5 pips) · Profit Factor 1.79
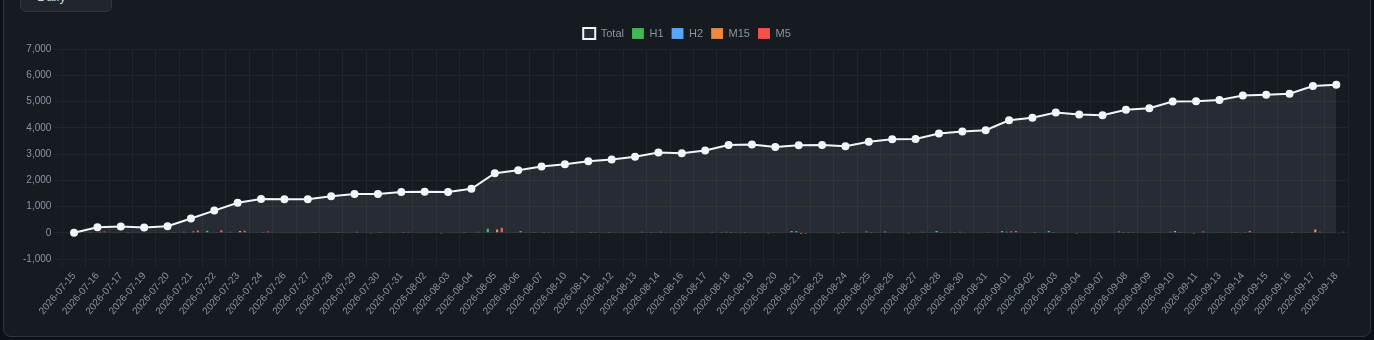
Period P&L
Weekly and Monthly Overview
Every figure below is pulled live from the public dashboard at
signals.fxmath.net,
which updates continuously. There is no demo account and no cherry-picking —
the losing trades are published right alongside the winners.
Performance by Timeframe — This Month
The edge is spread across timeframes rather than concentrated in one. The
H1 signal is the strongest at a profit factor of
2.52, while the
H2 signal is the laggard at
1.47 — published here because
that is exactly what an honest track record looks like.
| TF | Trades | Wins | Losses | Win Rate | Pips | Net P&L | PF |
|---|---|---|---|---|---|---|---|
| H1 | 31 | 16 | 15 | 51.6% | +4,254.9 | +$425.49 | 2.52 |
| H2 | 17 | 7 | 10 | 41.2% | +1,318.9 | +$131.89 | 1.47 |
| M15 | 136 | 64 | 72 | 47.1% | +5,965.9 | +$596.59 | 1.90 |
| M5 | 401 | 178 | 223 | 44.4% | +6,674.3 | +$667.43 | 1.56 |
| TOTAL | 585 | 265 | 320 | 45.3% | +18,214.0 | +$1,821.40 | 1.75 |

Daily Results — This Month
| Date | Trades | Wins | Losses | Win Rate | Net P&L | Pips |
|---|---|---|---|---|---|---|
| 2026-09-01 | 49 | 29 | 20 | 59.2% | +$408.70 | +4,087.0 |
| 2026-09-02 | 47 | 19 | 28 | 40.4% | +$104.33 | +1,043.3 |
| 2026-09-03 | 39 | 17 | 22 | 43.6% | +$210.81 | +2,108.1 |
| 2026-09-04 | 37 | 10 | 27 | 27.0% | -$82.83 | -828.3 |
| 2026-09-07 | 32 | 11 | 21 | 34.4% | -$27.97 | -279.7 |
| 2026-09-08 | 44 | 21 | 23 | 47.7% | +$223.16 | +2,231.6 |
| 2026-09-09 | 48 | 22 | 26 | 45.8% | +$67.36 | +673.6 |
| 2026-09-10 | 37 | 22 | 15 | 59.5% | +$267.16 | +2,671.6 |
| 2026-09-11 | 33 | 15 | 18 | 45.5% | +$17.80 | +178.0 |
| 2026-09-13 | 2 | 2 | 0 | 100.0% | +$44.56 | +445.6 |
| 2026-09-14 | 37 | 21 | 16 | 56.8% | +$187.72 | +1,877.2 |
| 2026-09-15 | 46 | 18 | 28 | 39.1% | +$28.94 | +289.4 |
| 2026-09-16 | 50 | 16 | 34 | 32.0% | +$39.78 | +397.8 |
| 2026-09-17 | 41 | 24 | 17 | 58.5% | +$294.25 | +2,942.5 |
| 2026-09-18 | 43 | 18 | 25 | 41.9% | +$37.63 | +376.3 |
Of 15 trading sessions this month, only
2 closed negative.
The Edge: Winners Are Larger Than Losers
- Average winning trade: +$14.73
- Average losing trade: -$7.38
- Win-to-loss size ratio: 2.00:1
- Break-even win rate at 1:2 R:R: 33.3%
- Actual win rate: 47.2% across 1,965 trades
- Risk protocol: Defined SL/TP · No Martingale · No Grid
Aurum wins fewer than half of its trades, and it is still profitable. The
reason is asymmetry: the average winner is about 2.0 times the size
of the average loser. At a 1:2 risk-to-reward ratio you only need to win one
trade in three to break even, so a mid-forties win rate with disciplined targets
produces a consistent positive expectancy.
Anyone selling you a 90% win rate is either hiding the losses or
running something where one bad week erases a year. This system is honest about
what it is.
How It Works
- One position per timeframe. Each timeframe opens a single
position, waits for the stop loss or take profit to hit, then evaluates the next
entry. No overlapping exposure. - No grid, no martingale. Every trade carries a defined stop
loss and take profit before it is opened. Nothing is averaged down. - FIFO-compliant. Because only one position runs per timeframe,
the system is fully compatible with US broker FIFO rules. - Small accounts welcome. You can start from $50 to $100 and
scale up as the account grows. - Smart signal copier. One master EA broadcasts; unlimited slave
terminals receive and execute instantly on MT4 or MT5, at any broker or VPS. - Flexible risk. Fixed pips, account percentage, or ATR-based
stops, with a maximum lot cap and slippage control.
Open Positions Right Now
The dashboard also streams positions as they open. At the time of writing it was
holding 4 positions, floating
+$36.58 (+365.8 pips).
| TF | Dir | Entry | SL | TP | Floating | Pips |
|---|---|---|---|---|---|---|
| H2 | BUY | 4,353.92 | 4,316.07 | 4,429.61 | +$22.40 | +224.0 |
| H1 | BUY | 4,356.32 | 4,336.23 | 4,396.50 | +$20.00 | +200.0 |
| M15 | BUY | 4,382.92 | 4,373.44 | 4,401.88 | -$6.60 | -66.0 |
| M5 | SELL | 4,377.10 | 4,380.11 | 4,371.07 | +$0.78 | +7.8 |
| FLOATING TOTAL | +$36.58 | +365.8 | ||||

All Windows at a Glance
| Period | Trades | Win Rate | Pips | Net P&L | PF |
|---|---|---|---|---|---|
| This Week | 219 | 45.2% | +6,328.8 | +$632.88 | 1.73 |
| This Month | 585 | 45.3% | +18,214.0 | +$1,821.40 | 1.75 |
| All Time | 1,965 | 47.2% | +60,200.5 | +$6,020.05 | 1.79 |
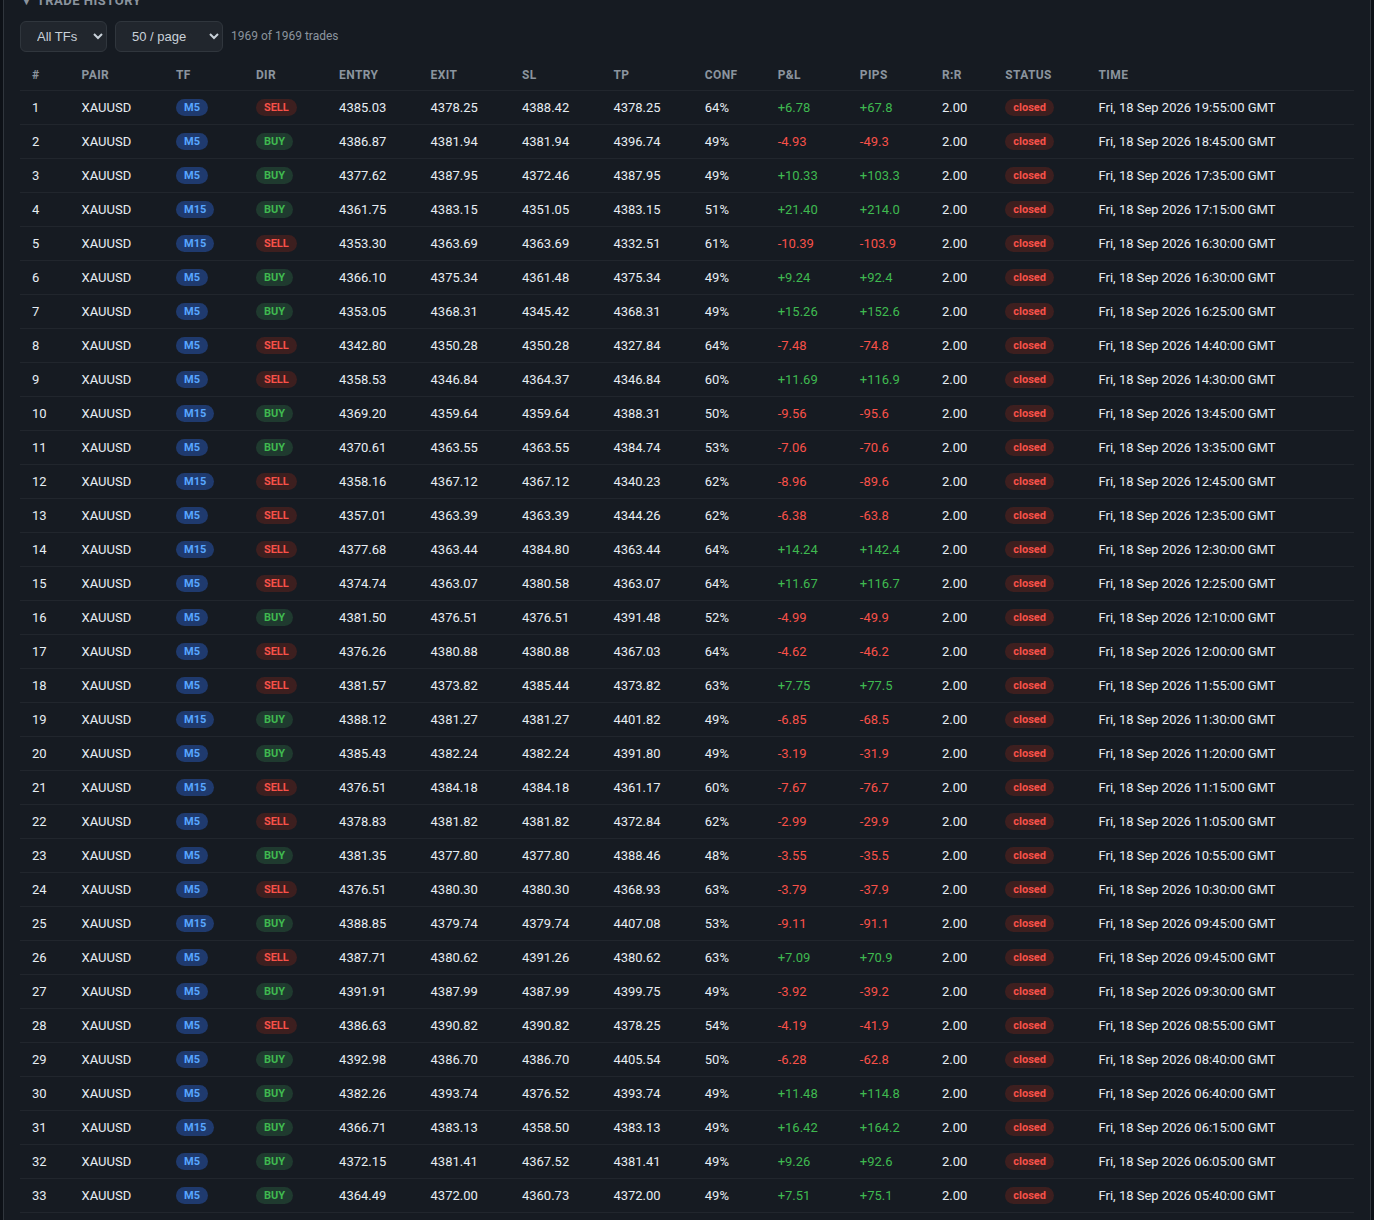
Full Transparency: Verify Every Trade
No black boxes. Every trade is broadcast in real time with its timeframe,
direction, entry, exit and result. You can check the figures in this post
yourself, without a licence.
- Live dashboard: signals.fxmath.net (updates continuously)
- Free Telegram channel: t.me/FxMathAurum (instant alerts on every open and close)
- Full trade history: blog.fxmath.net
Pricing & Payment
Same features on every plan — only the duration differs. Each licence
covers one MT4 or MT5 account with all available timeframes (M5, M15, H1 and H2),
plus real-time Telegram alerts and full dashboard access. The live dashboard and
Telegram alerts are free for everyone, no licence required.
· USDT · USDC · BNB · SOL · LTC · DOGE
and more. After payment you receive your licence key and setup instructions by
email, usually within 24 hours.
Pay directly at the secure checkout
(fxmath.com/pay)
or via the storefront.
Need help choosing or upgrading? Contact
@FxMath on Telegram
or email [email protected].
Registration and account setup happen at
copier.fxmath.net/client,
and the install guide is at
fxmath.net/docs.html.
leveraged gold CFDs (XAUUSD), involves substantial risk of loss and is not
suitable for every investor. Past performance is not indicative of future
results. These are live results from a real master account, but they do not
guarantee future performance. Always test automated systems on a demo account
before considering live deployment, and never risk money you cannot afford to
lose.
Tags
FxMathAurum MLLive ResultsXAUUSDGoldGold TradingMachine LearningAlgorithmic TradingExpert AdvisorMT4MT5Trade Copier
Discover more from FxMath Financial Solution
Subscribe to get the latest posts sent to your email.