18 Optimised MT5 Strategies, Tested and Compared
28 pair-and-timeframe combinations were searched.
18 survived and 10 were thrown away.
This is every one of them, with the numbers, the ranking and the risks.
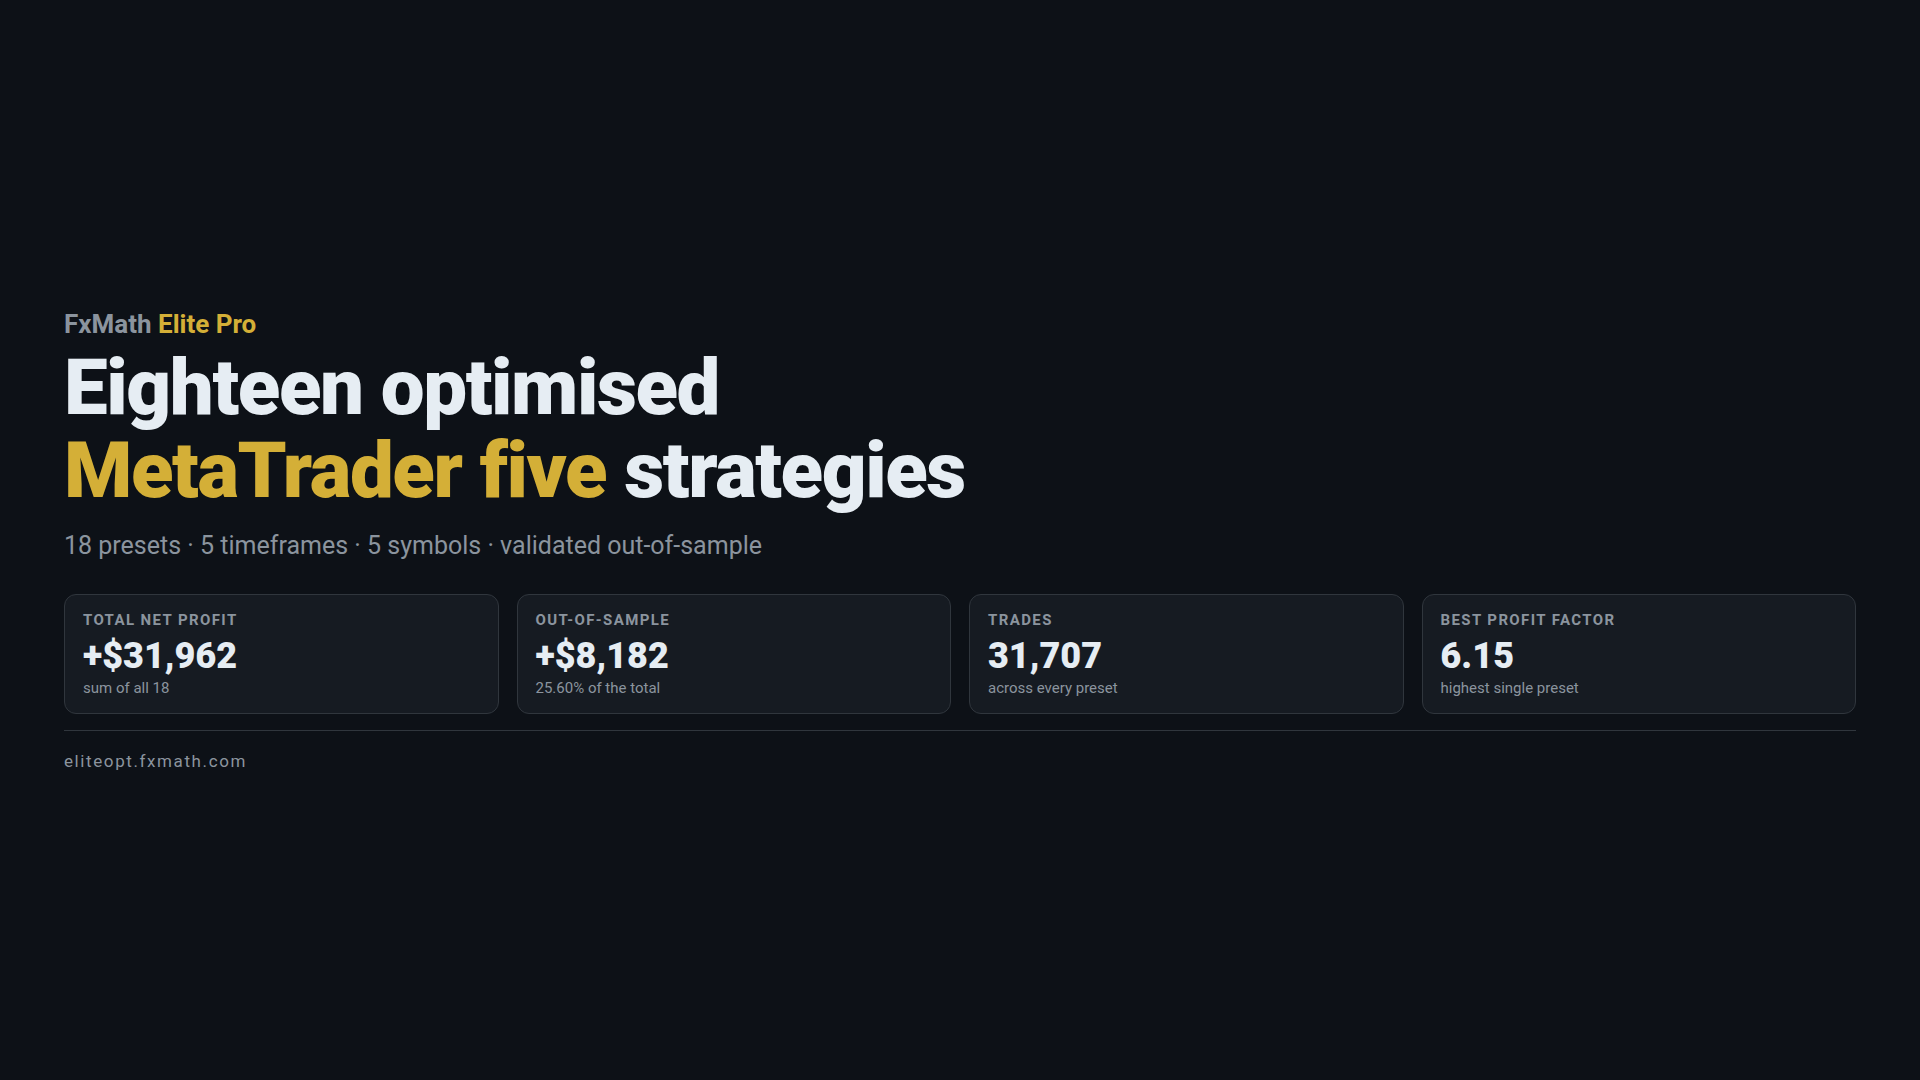
Every figure below is read from the same data file the live dashboard
publishes. The reports and the numbers here cannot drift apart, because there
is only one source.
The rule that decides what ships
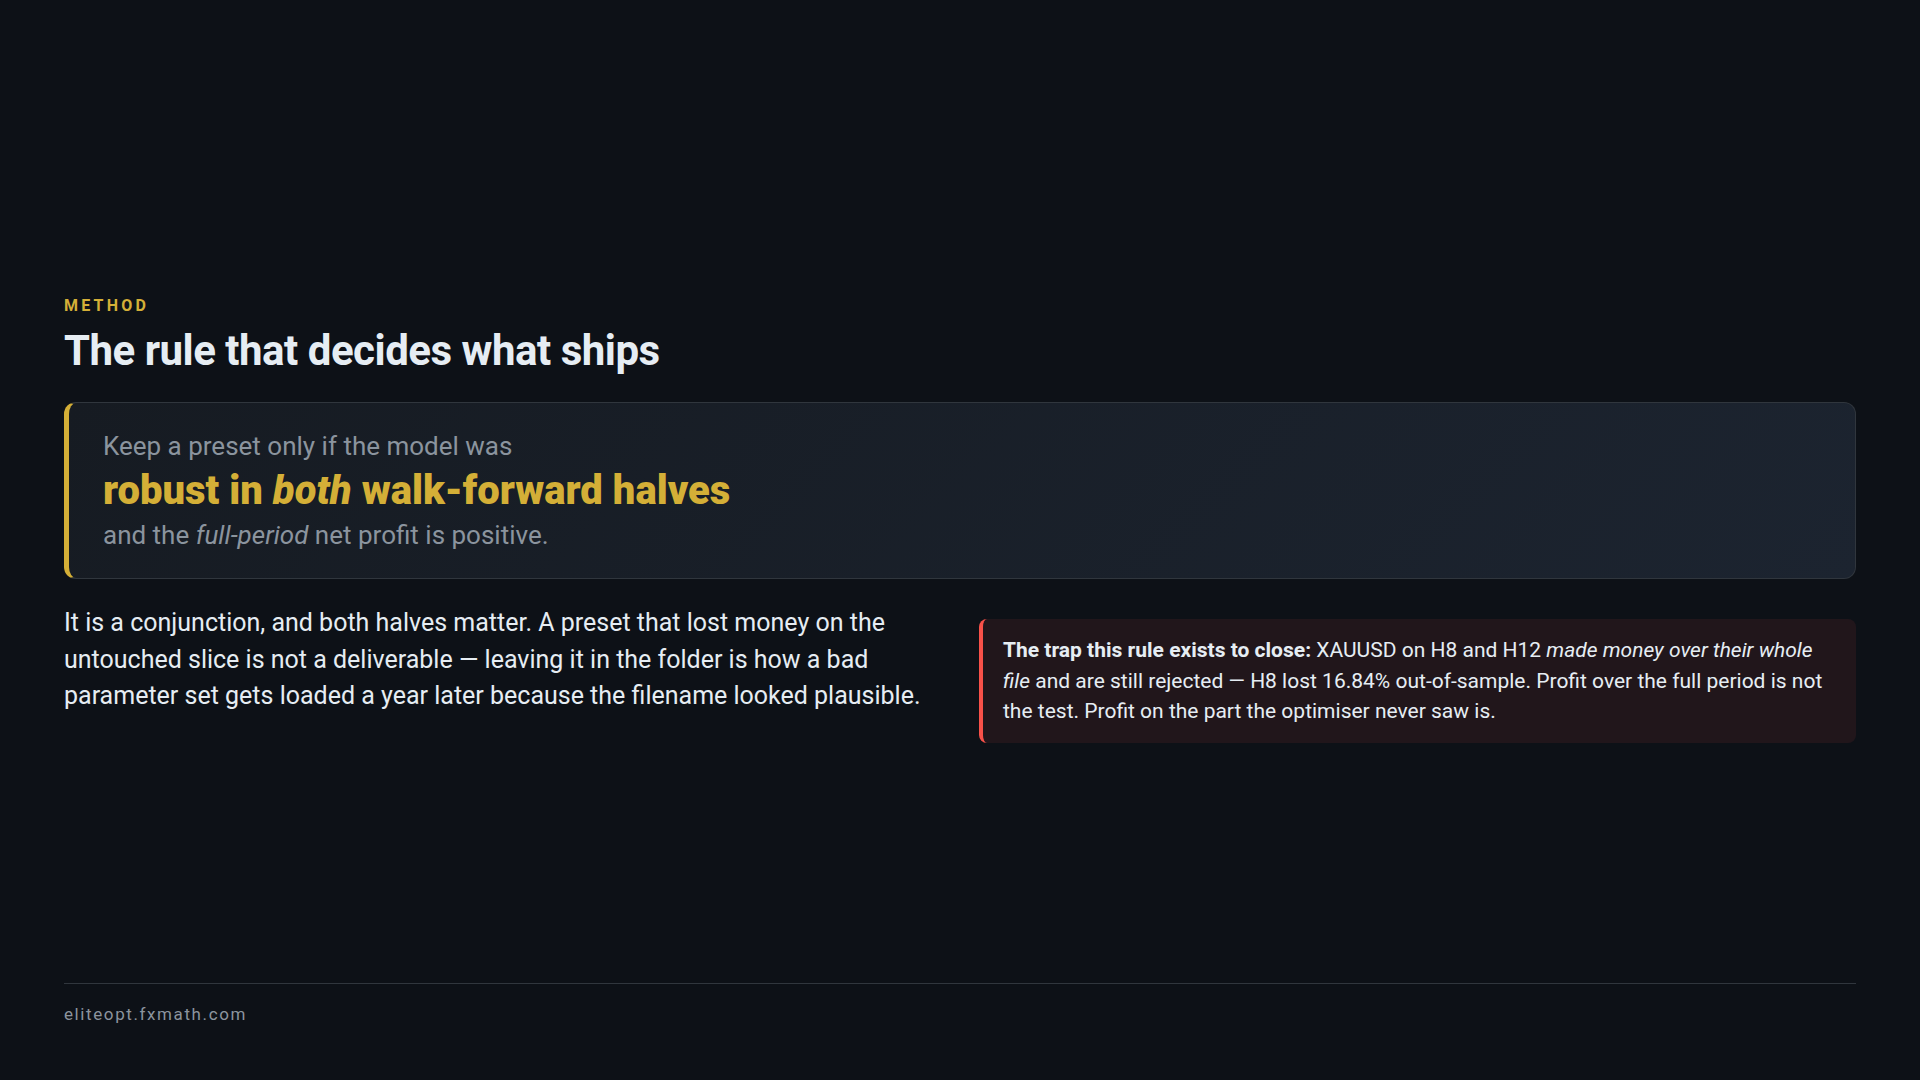
A preset was kept only if the model was robust in both halves of a
walk-forward split AND the full-period net profit is
positive. It is a conjunction, and both halves matter.
The rule exists to close one specific trap:
XAUUSD on H8 and H12 made money over their whole file and are still
rejected, because the 8-hour version lost 16.84% on the part the
optimiser never saw. Profit over the full period is not the test. Profit on
the slice the optimiser never touched is.
How the strategy actually trades
- An ensemble of 20 decision trees scores every bar from a
12-bar context window and a 15-bar back-look. - If the score clears the threshold it opens 0.01 lots and
sets a small basket take-profit. - If price moves against it, the EA adds a level every grid distance
— usually 5 to 8 levels — averaging the
entry. - The whole basket closes together. Most exits are a small win; almost
none are a loss.
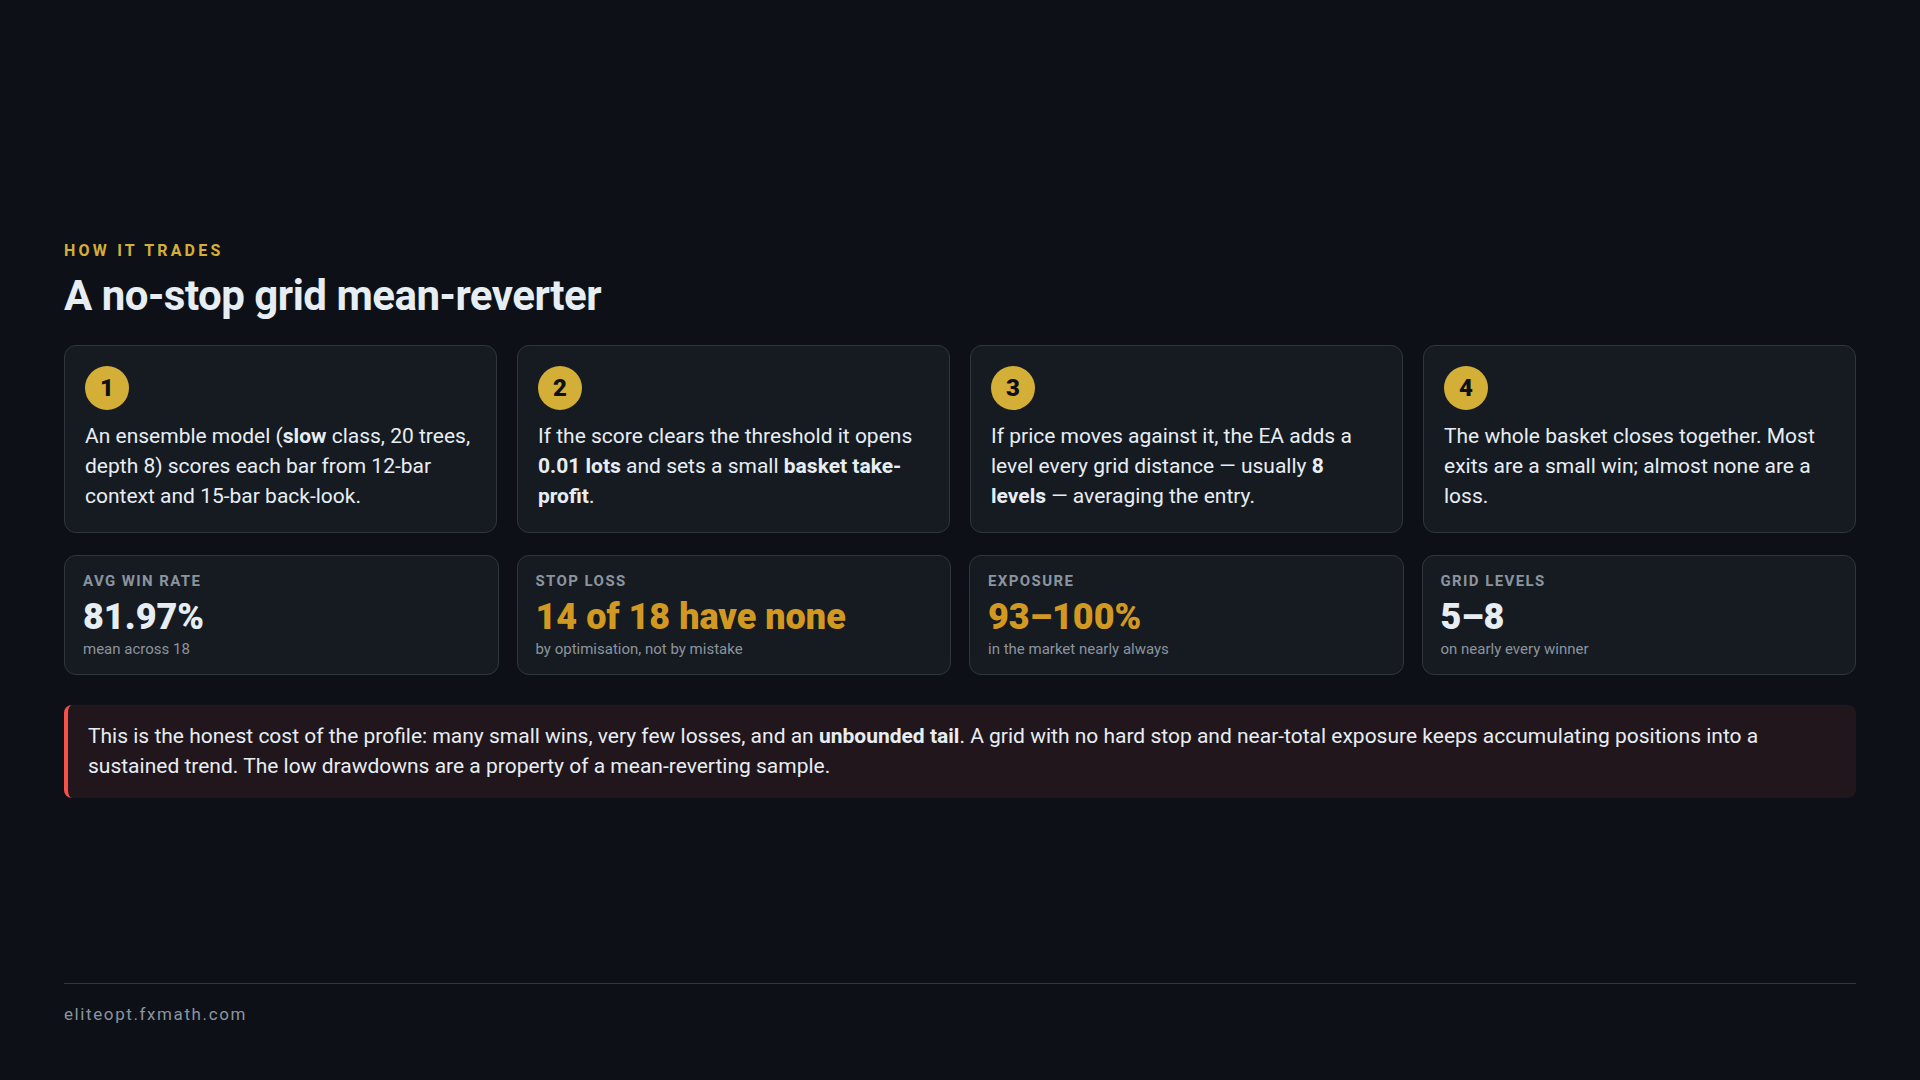
Average win rate is 82.0%, and
14 of the 18 presets have no stop loss at
all — the optimiser found a stop unprofitable on this sample, so
it did not select one. A grid with no hard stop and 93–100% exposure keeps
accumulating positions into a sustained trend. The low drawdowns are a property
of a mean-reverting sample, not a structural safety feature.
All 18 presets, honestly ranked
Sorted by profit per dollar of drawdown, which is the ranking that decides
whether an account survives — not the one that looks best in a headline.
A preset that doubles an account while risking ninety percent of it is not
better than one that adds twenty percent while risking two.
| # | Symbol | TF | Net | Return | Max DD | PF | Trades | Win % | OOS |
|---|---|---|---|---|---|---|---|---|---|
| 1 | EURUSD | M30 | +$2,177 | 21.77% | 2.72% | 5.58 | 1,549 | 86.4% | +$710 |
| 2 | EURUSD | M15 | +$1,632 | 16.32% | 2.13% | 3.06 | 1,057 | 81.4% | +$310 |
| 3 | USDCHF | H2 | +$276 | 2.76% | 0.37% | 1.91 | 95 | 77.9% | +$36 |
| 4 | EURUSD | H1 | +$1,942 | 19.42% | 2.65% | 5.82 | 979 | 86.7% | +$362 |
| 5 | GBPUSD | H2 | +$1,429 | 14.29% | 2.20% | 6.15 | 335 | 89.9% | +$316 |
| 6 | GBPUSD | M15 | +$2,570 | 25.70% | 4.13% | 3.63 | 4,094 | 80.5% | +$692 |
| 7 | USDCHF | M30 | +$1,839 | 18.39% | 2.96% | 4.14 | 1,466 | 85.4% | +$717 |
| 8 | EURUSD | H2 | +$1,062 | 10.62% | 1.80% | 4.75 | 605 | 81.3% | +$160 |
| 9 | USDCAD | H1 | +$673 | 6.73% | 1.33% | 2.64 | 632 | 86.6% | +$154 |
| 10 | GBPUSD | H1 | +$1,231 | 12.31% | 2.51% | 4.89 | 377 | 90.2% | +$417 |
| 11 | XAUUSD | H2 | +$5,943 | 59.43% | 12.92% | 2.43 | 969 | 91.3% | +$1,769 |
| 12 | USDCHF | H1 | +$1,615 | 16.15% | 3.54% | 4.38 | 1,425 | 81.6% | +$650 |
| 13 | GBPUSD | M30 | +$1,876 | 18.76% | 4.95% | 3.71 | 1,443 | 83.2% | +$636 |
| 14 | USDCHF | M15 | +$1,758 | 17.58% | 5.16% | 1.93 | 8,713 | 69.2% | +$593 |
| 15 | USDCAD | M15 | +$228 | 2.28% | 0.73% | 1.12 | 3,309 | 67.1% | +$45 |
| 16 | USDCAD | M30 | +$271 | 2.71% | 1.11% | 1.12 | 3,641 | 66.9% | +$17 |
| 17 | XAUUSD | H6 | +$3,666 | 36.66% | 28.82% | 1.29 | 677 | 84.5% | +$78 |
| 18 | XAUUSD | H1 | +$1,774 | 17.74% | 16.94% | 1.33 | 341 | 85.6% | +$522 |
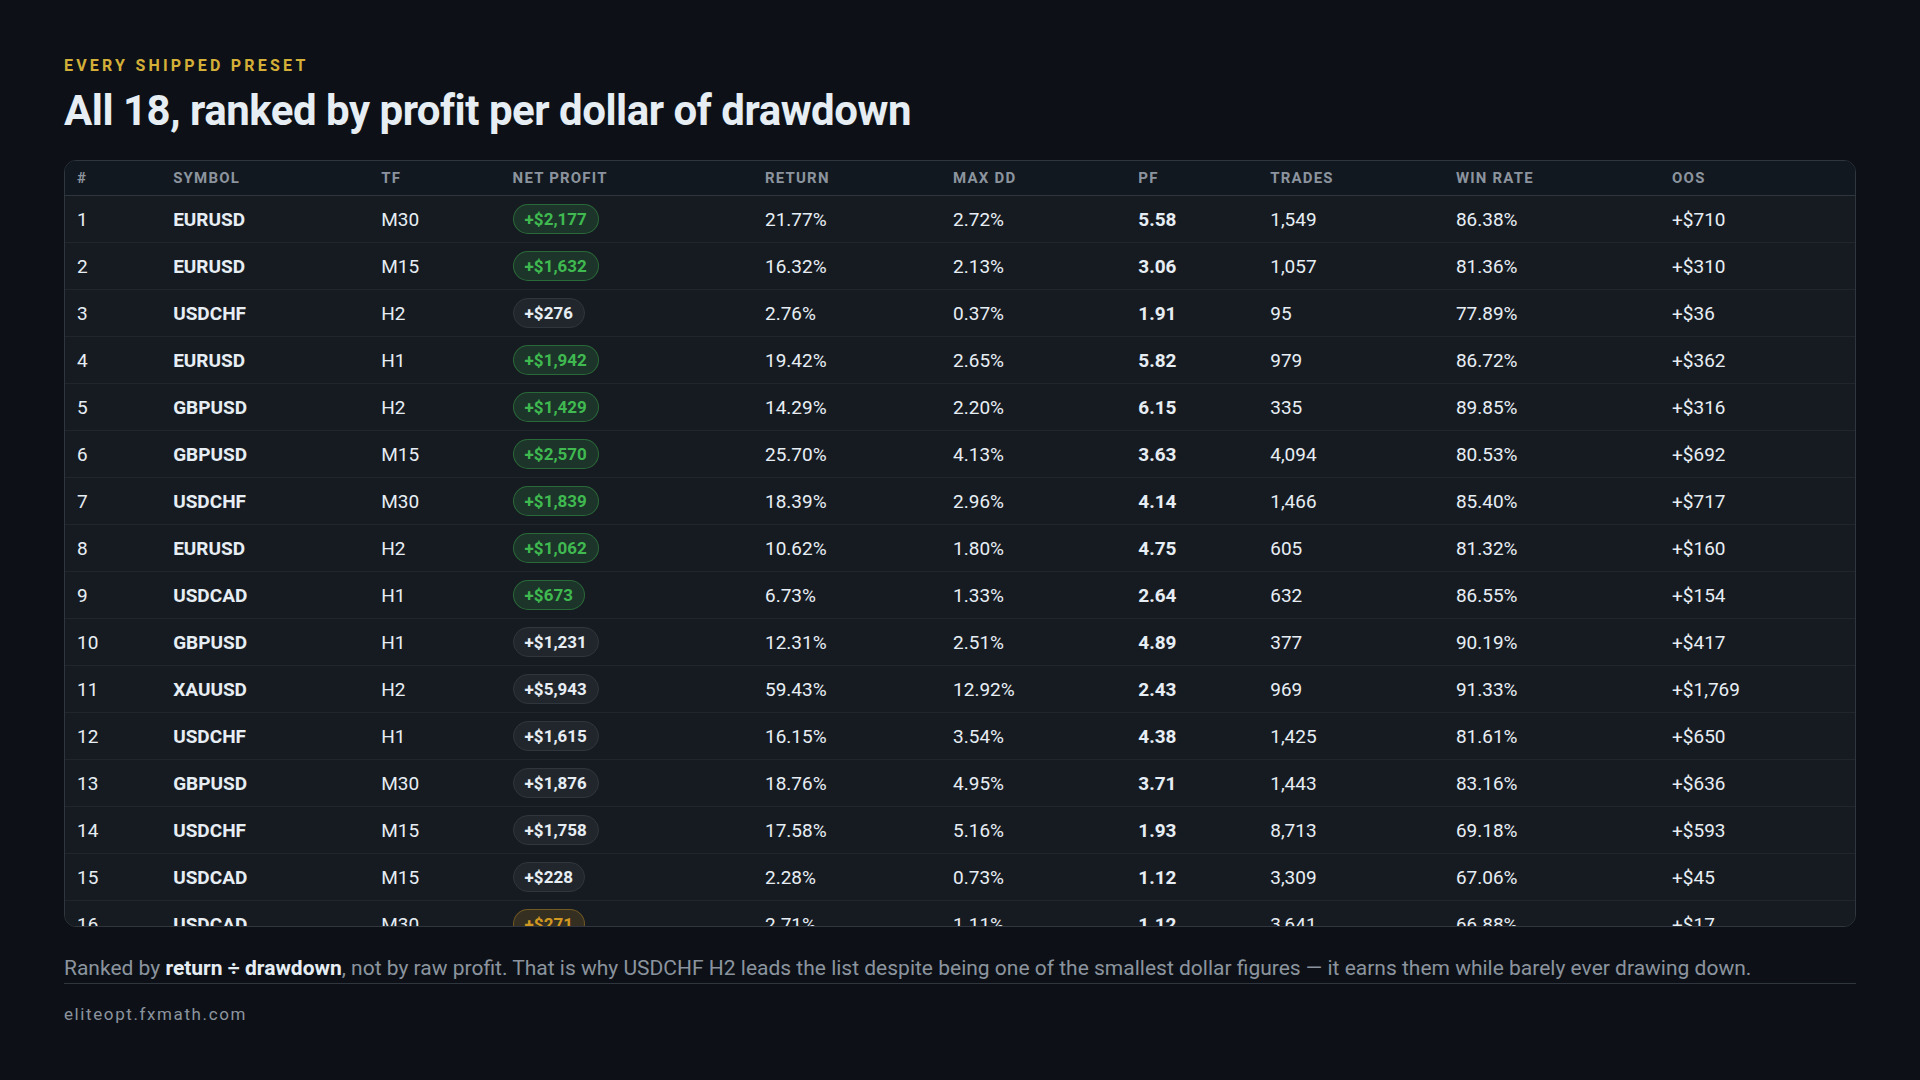
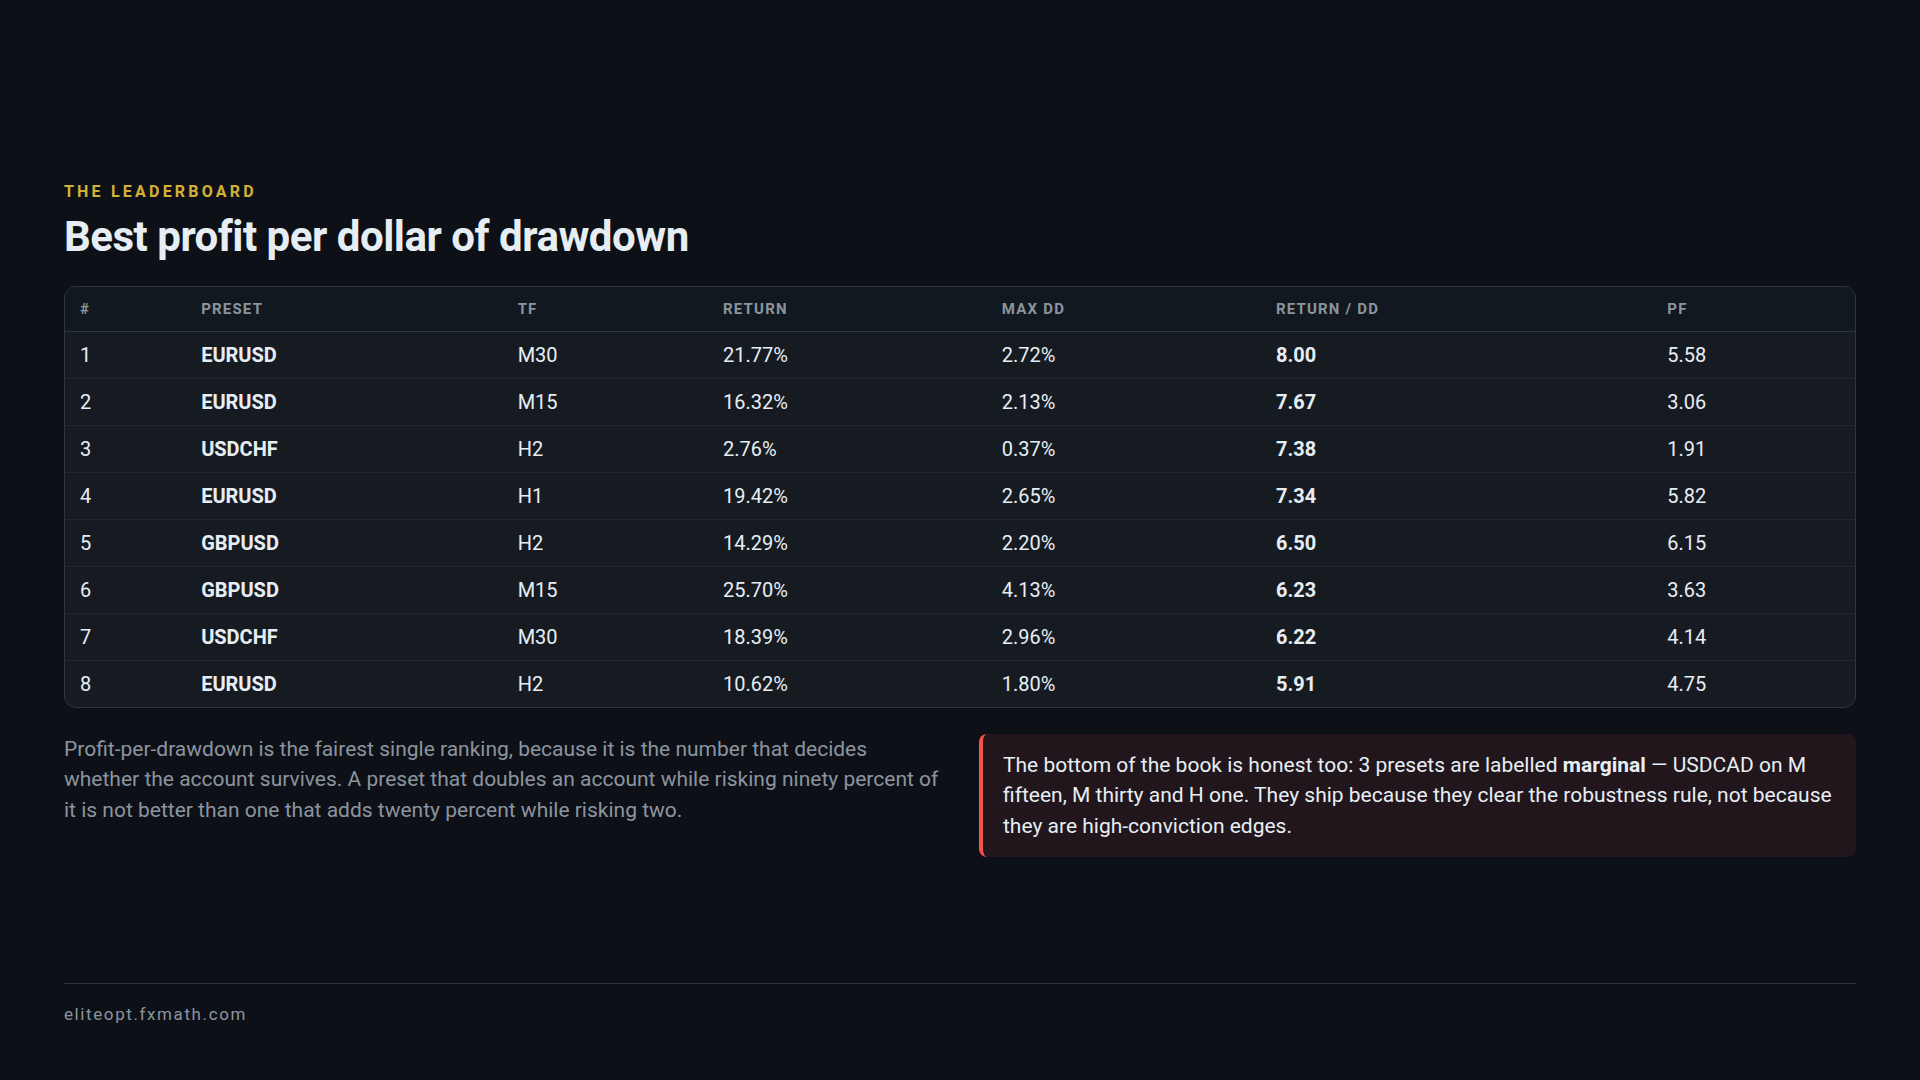
The top of that table is EURUSD M30, which
returns 21.77% against a maximum drawdown of 2.72% —
8.00 dollars of return per dollar of drawdown. The highest profit
factor in the library is GBPUSD H2 at
6.15, and the smallest account that can carry any preset is
$76 for
USDCHF H2.
The leaderboard
| # | Preset | TF | Return | Max DD | Return/DD | PF |
|---|---|---|---|---|---|---|
| 1 | EURUSD | M30 | 21.77% | 2.72% | 8.00 | 5.58 |
| 2 | EURUSD | M15 | 16.32% | 2.13% | 7.67 | 3.06 |
| 3 | USDCHF | H2 | 2.76% | 0.37% | 7.38 | 1.91 |
| 4 | EURUSD | H1 | 19.42% | 2.65% | 7.34 | 5.82 |
| 5 | GBPUSD | H2 | 14.29% | 2.20% | 6.50 | 6.15 |
| 6 | GBPUSD | M15 | 25.70% | 4.13% | 6.23 | 3.63 |
| 7 | USDCHF | M30 | 18.39% | 2.96% | 6.22 | 4.14 |
| 8 | EURUSD | H2 | 10.62% | 1.80% | 5.91 | 4.75 |
Three comparisons that matter more than the table
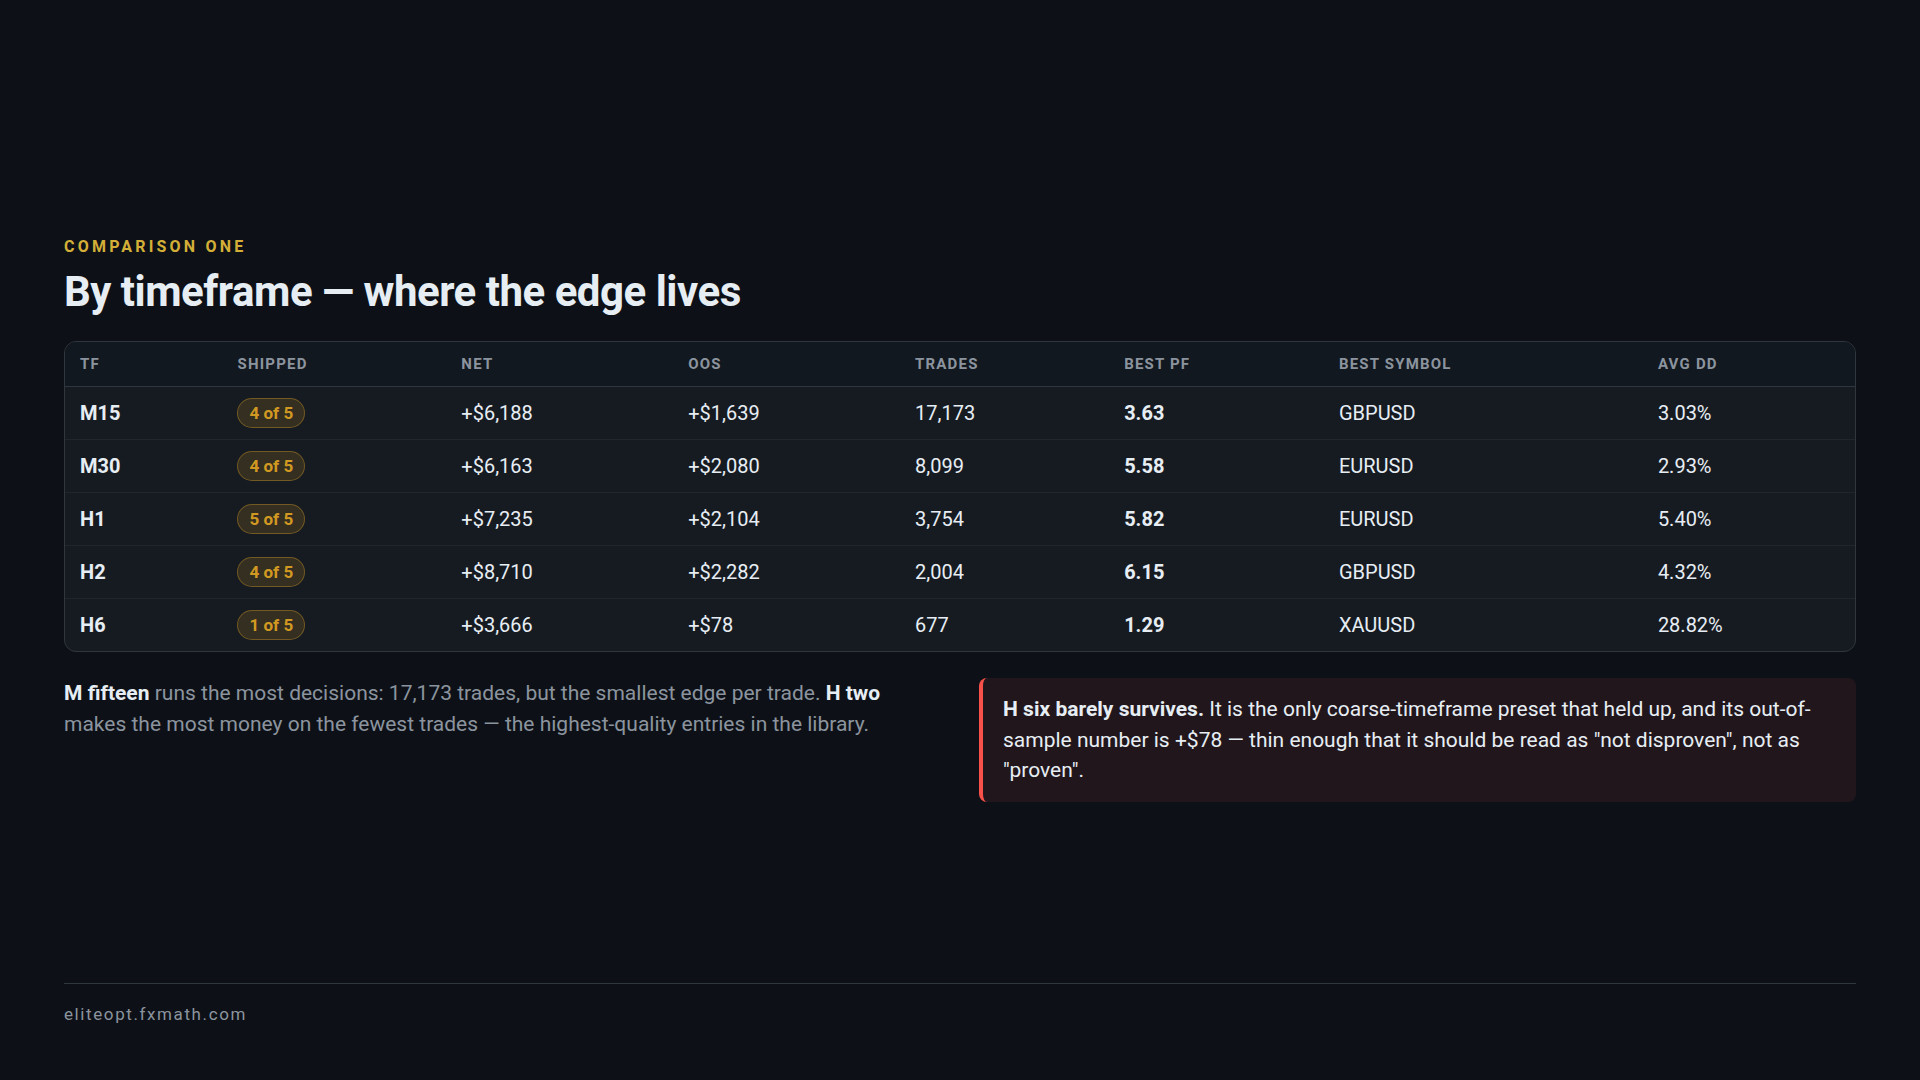
1. By timeframe
| TF | Shipped | Net | OOS | Trades | Best PF | Avg DD |
|---|---|---|---|---|---|---|
| M15 | 4 of 5 | +$6,188 | +$1,639 | 17,173 | 3.63 | 3.03% |
| M30 | 4 of 5 | +$6,163 | +$2,080 | 8,099 | 5.58 | 2.93% |
| H1 | 5 of 5 | +$7,235 | +$2,104 | 3,754 | 5.82 | 5.40% |
| H2 | 4 of 5 | +$8,710 | +$2,282 | 2,004 | 6.15 | 4.32% |
| H6 | 1 of 5 | +$3,666 | +$78 | 677 | 1.29 | 28.82% |
M15 runs the most decisions but earns the least per trade.
H2 makes the most money on the fewest trades — the
highest-quality entries in the library. H6 barely survives: it
is the only coarse-timeframe preset that held up, and its out-of-sample number
is thin enough that it should be read as “not disproven”, not
“proven”.
2. By symbol
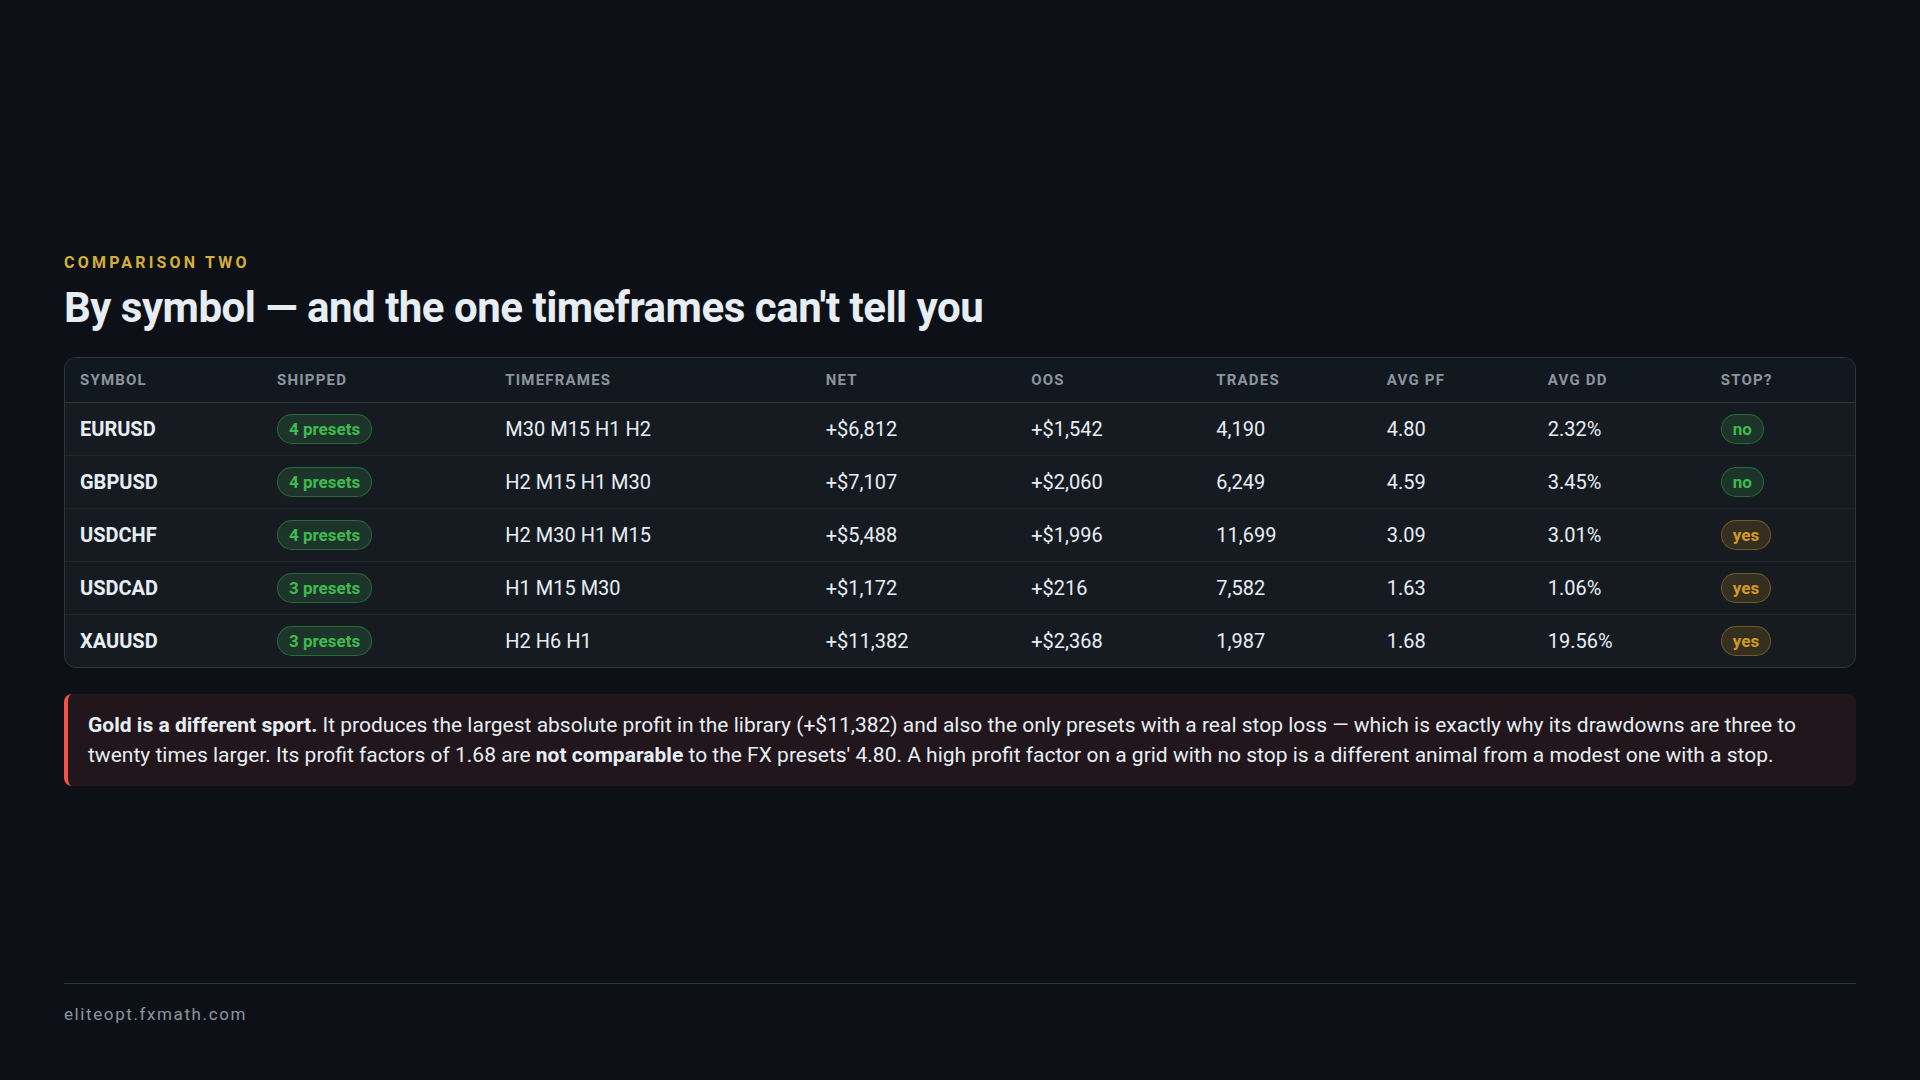
| Symbol | Shipped | Timeframes | Net | OOS | Trades | Avg PF | Avg DD | Stop? |
|---|---|---|---|---|---|---|---|---|
| EURUSD | 4 presets | M30 M15 H1 H2 | +$6,812 | +$1,542 | 4,190 | 4.80 | 2.32% | no |
| GBPUSD | 4 presets | H2 M15 H1 M30 | +$7,107 | +$2,060 | 6,249 | 4.59 | 3.45% | no |
| USDCHF | 4 presets | H2 M30 H1 M15 | +$5,488 | +$1,996 | 11,699 | 3.09 | 3.01% | yes |
| USDCAD | 3 presets | H1 M15 M30 | +$1,172 | +$216 | 7,582 | 1.63 | 1.06% | yes |
| XAUUSD | 3 presets | H2 H6 H1 | +$11,382 | +$2,368 | 1,987 | 1.68 | 19.56% | yes |
Gold is a different sport. The XAUUSD presets produce the
largest absolute profit in the library and are also the only ones with a real
stop loss — which is exactly why their drawdowns are three to twenty times
larger. Their profit factor is not comparable to the FX
presets’. A modest profit factor on a grid with no stop is a different animal
from a high one with a stop.
3. Do they actually diversify?
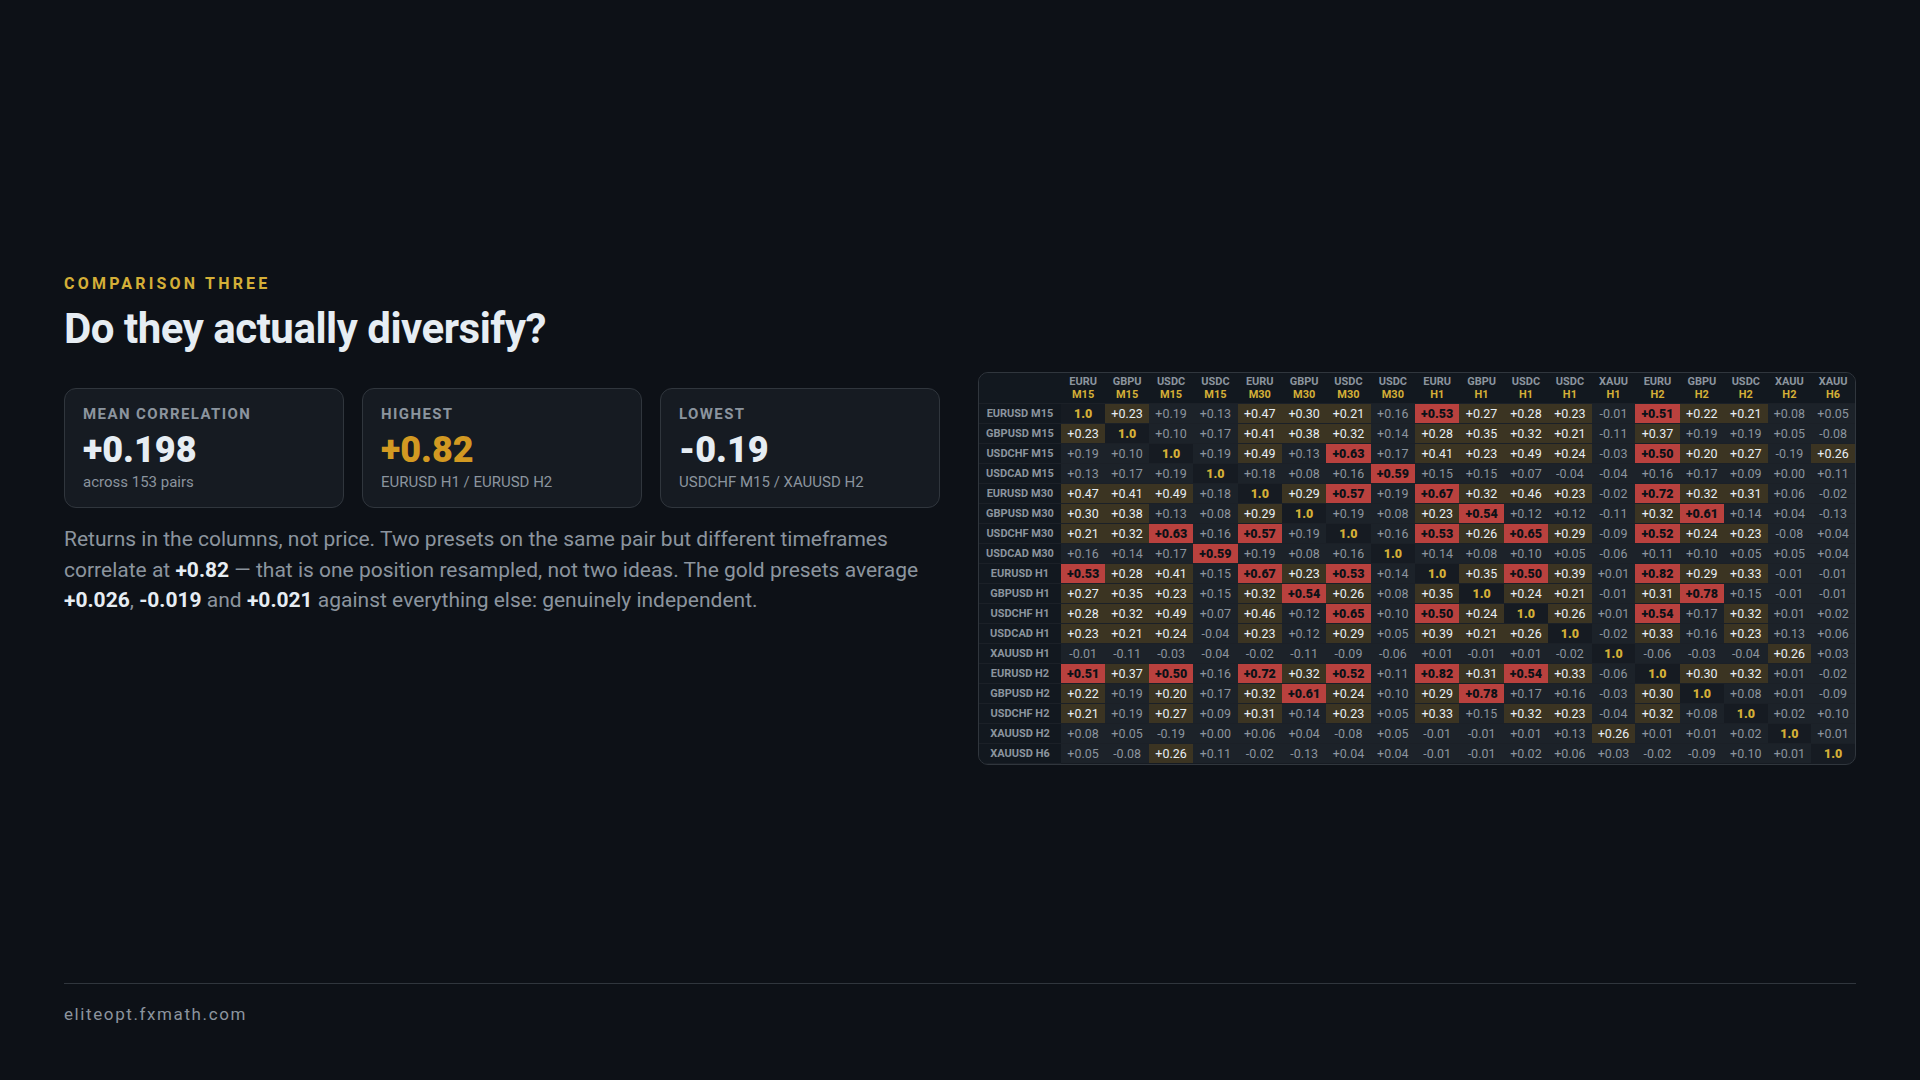
Mean daily-return correlation across all 153 preset pairs is
+0.198. But the interesting number is the
highest cell: EURUSD H1 and EURUSD H2 correlate at
+0.82. That is not two ideas, it is one position
resampled onto a different clock. The gold presets, by contrast, sit near zero
against everything else — those are the genuinely independent strategies
in this book.
What the account actually has to hold
| Preset | TF | Min. balance | Worst float |
|---|---|---|---|
| USDCHF | H2 | $76 | -$34 |
| USDCAD | M15 | $150 | -$12 |
| USDCAD | M30 | $229 | -$26 |
| USDCAD | H1 | $280 | -$156 |
| EURUSD | H2 | $390 | -$230 |
| EURUSD | M15 | $460 | -$241 |
| GBPUSD | H2 | $461 | -$249 |
| GBPUSD | H1 | $514 | -$266 |
| EURUSD | M30 | $610 | -$322 |
| EURUSD | H1 | $610 | -$360 |
| USDCHF | M30 | $649 | -$348 |
| USDCHF | H1 | $720 | -$376 |
| GBPUSD | M15 | $873 | -$752 |
| USDCHF | M15 | $1,055 | -$604 |
| GBPUSD | M30 | $1,058 | -$649 |
| XAUUSD | H2 | $3,271 | -$1,707 |
| XAUUSD | H1 | $3,871 | -$520 |
| XAUUSD | H6 | $11,067 | -$5,808 |
Every preset is bound by its drawdown budget — the
worst backtest drawdown doubled — never by margin. The whole
USDCHF H2 preset carries 0.24 lots at peak, about
fifty-seven dollars of margin at 1:500. Opening the trade was never the problem.
Sitting through the float is.
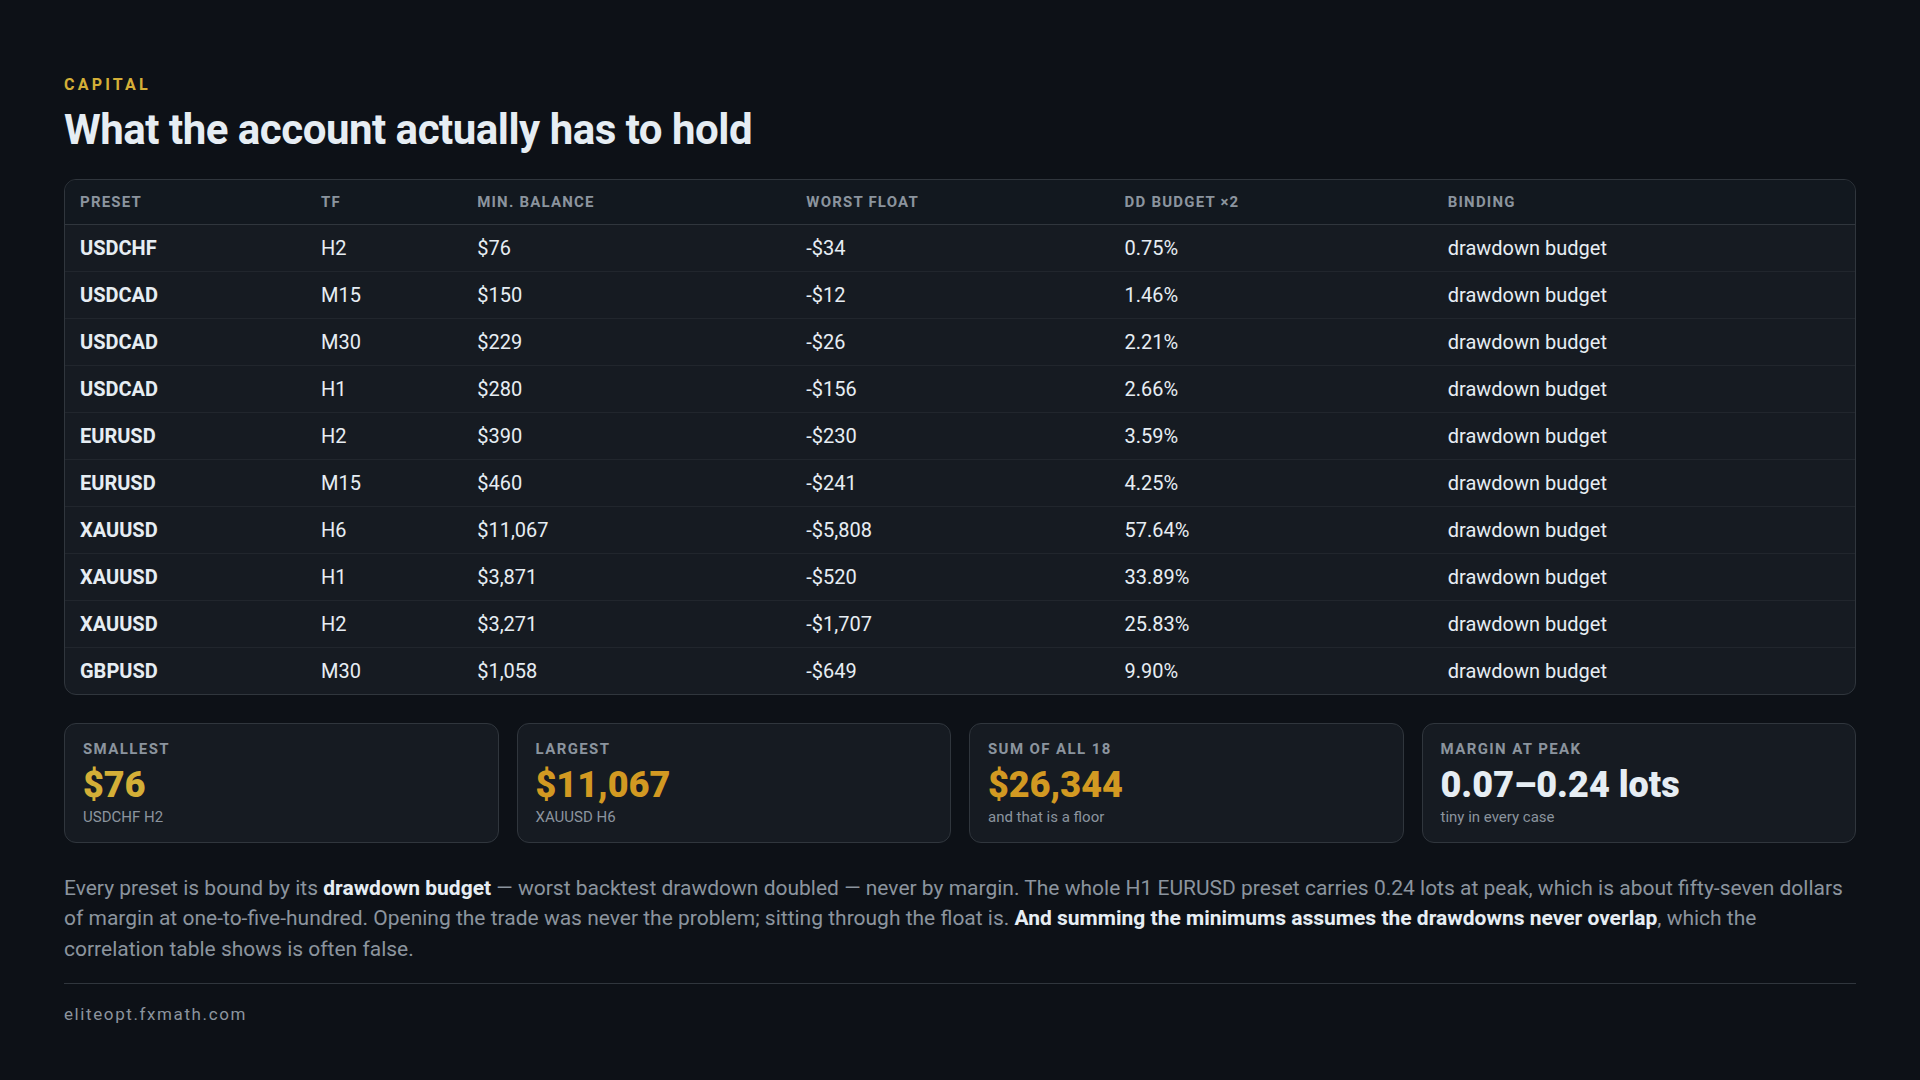
Summing those minimums assumes the drawdowns never overlap,
which the correlation table above shows is often false. Treat
$26,344 as a floor, not a plan.
What could go wrong
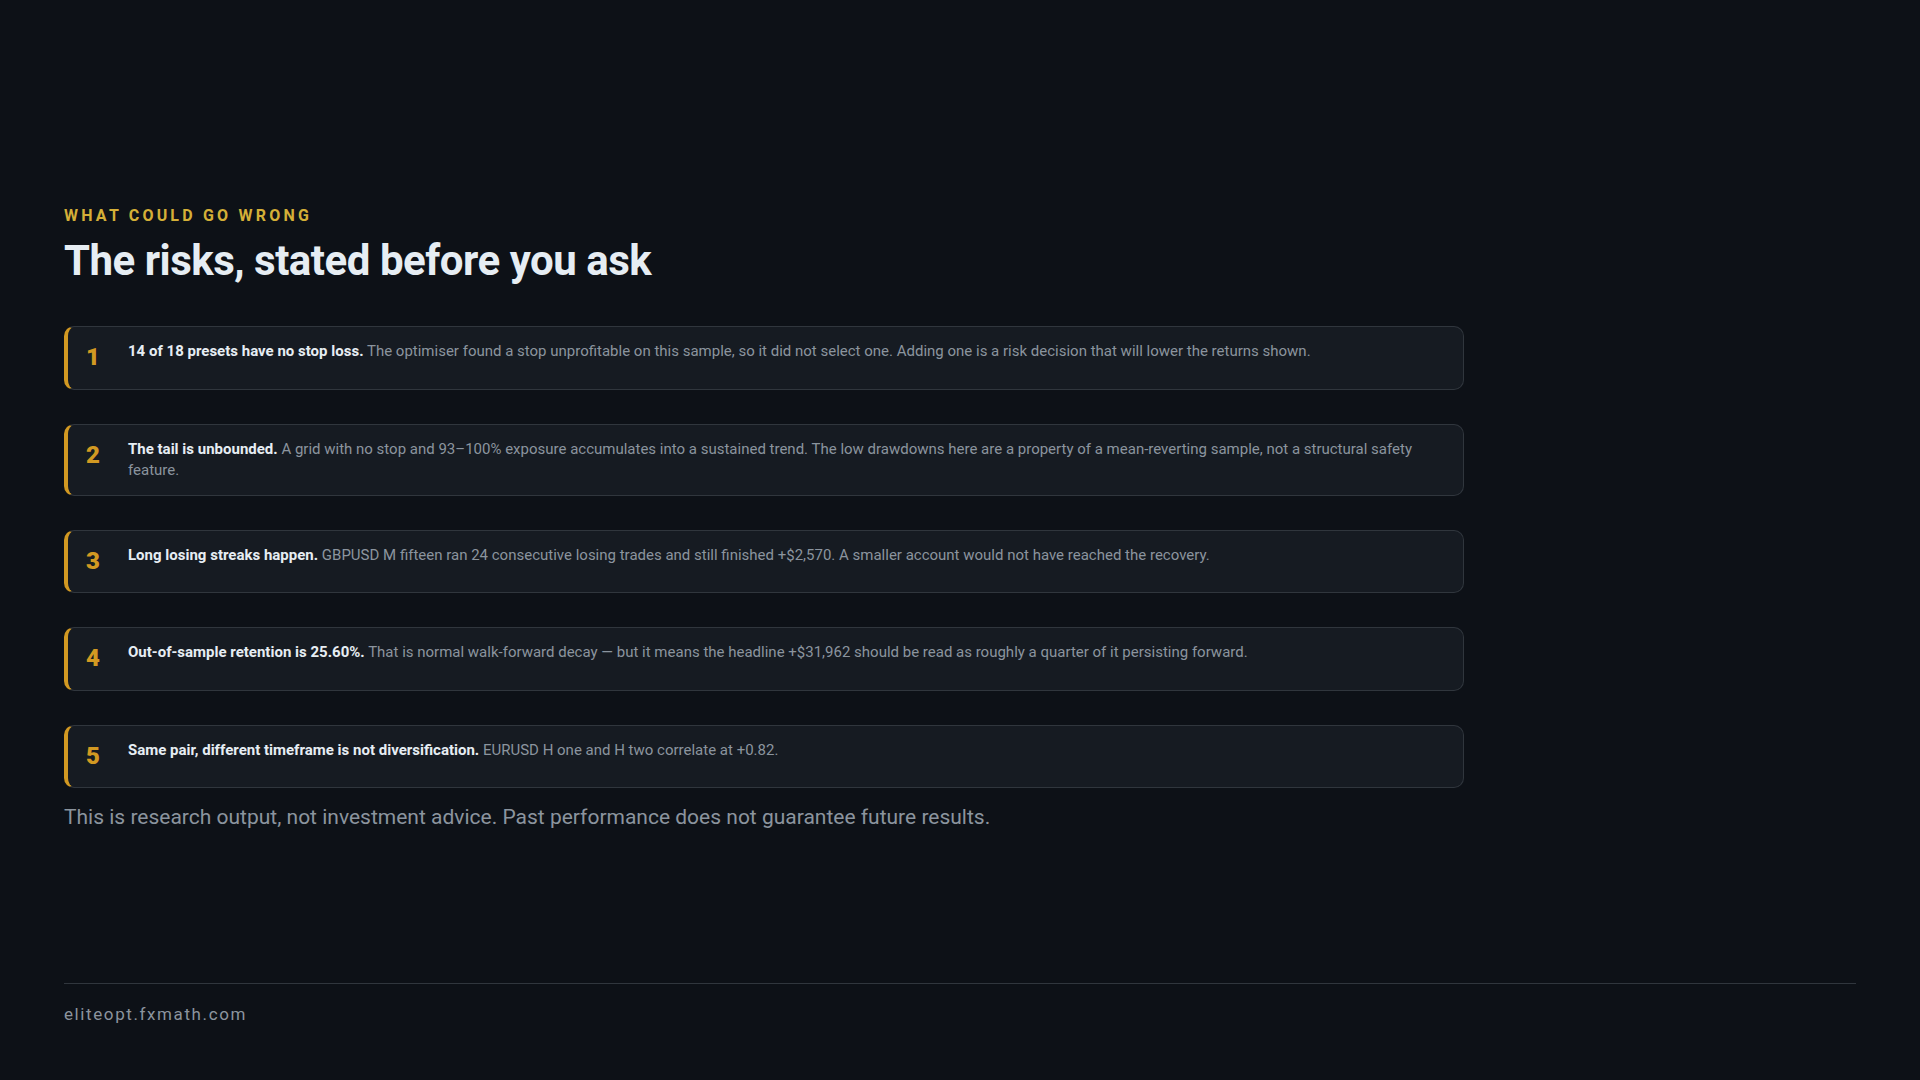
- 14 of 18 presets have no stop loss.
The optimiser found one unprofitable on this sample, so it did not select
one. Adding one is a risk decision that will lower the returns shown. - The tail is unbounded. A grid with no stop and
93–100% exposure accumulates into a sustained trend. - Long losing streaks happen. GBPUSD M15 ran
24 consecutive losing trades and still
finished profitable. A smaller account would not have reached the
recovery. - Out-of-sample retention is 25.60%. That is
normal walk-forward decay, but it means the headline
+$31,962 should be read as roughly a quarter of it
persisting forward. - Same pair, different timeframe is not diversification.
EURUSD H1 and H2 correlate at +0.82.
Past performance does not guarantee future results. Trading forex and metals on
margin carries a high level of risk and can result in the loss of all invested
capital. Trade responsibly.
Get the files, and read the reports first
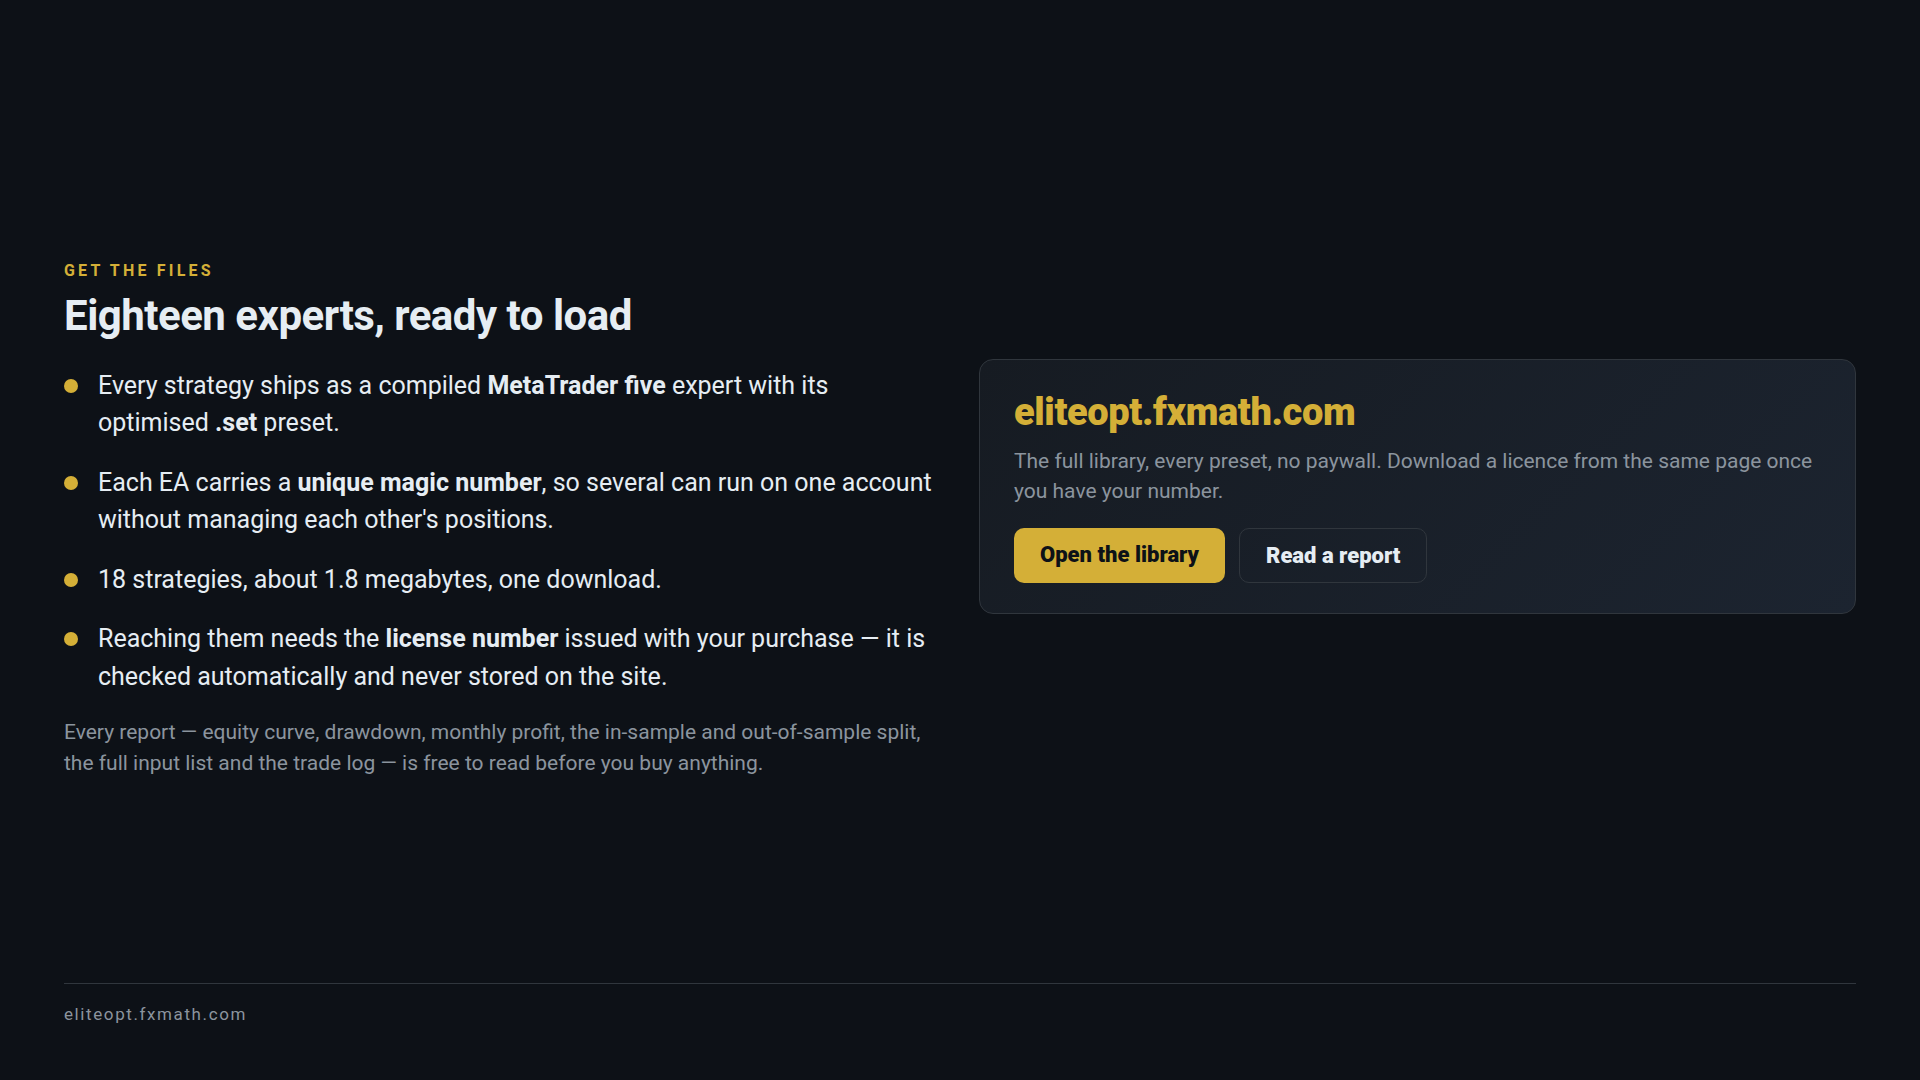
Every strategy ships as a compiled MetaTrader 5 expert with its optimised
.set preset, and each carries a unique magic number
so several can run on one account without managing each other’s positions.
18 strategies, about 1.8 megabytes, one download.
Every report — equity curve, drawdown, monthly profit, the in-sample
and out-of-sample split, the full input list and the trade log — is
free to read before you buy anything.
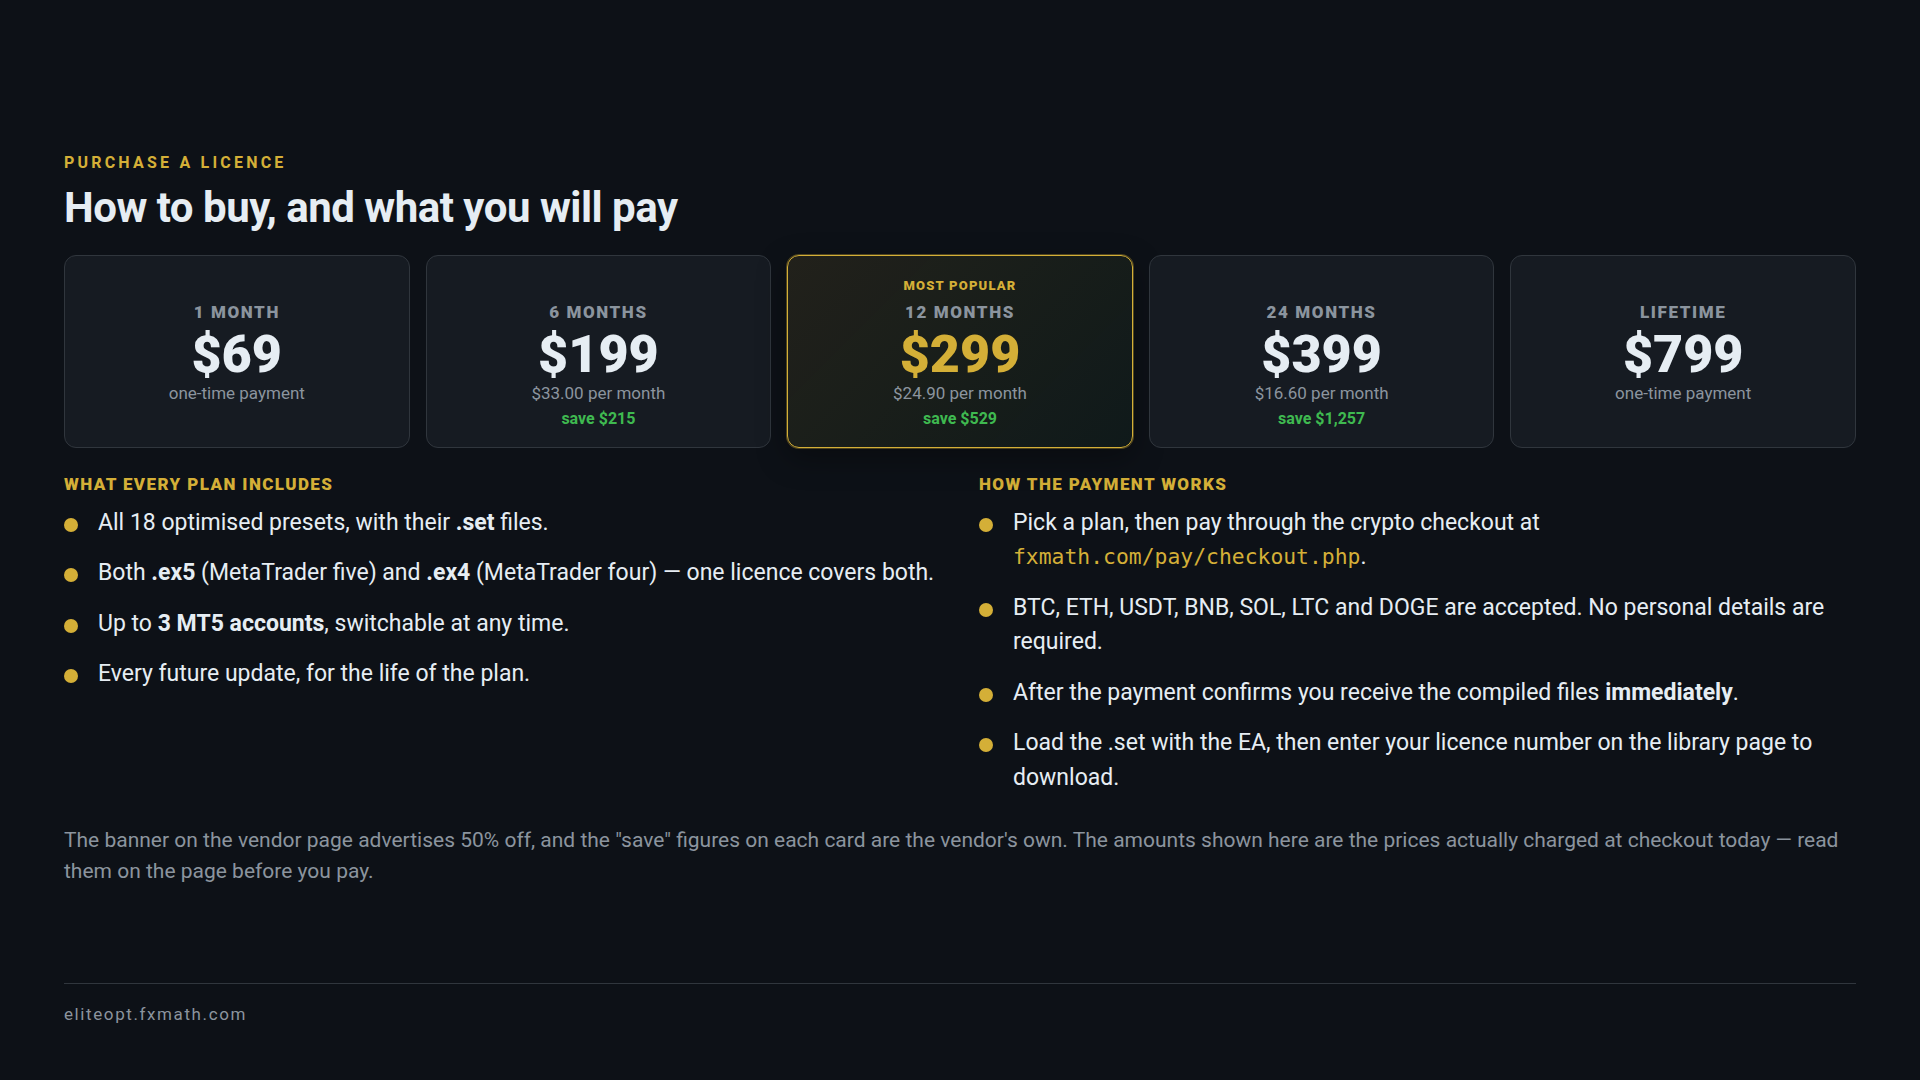
How to buy, and what you pay
Every plan includes all 18 optimised presets with their
.set files, both the .ex5 (MetaTrader 5) and
.ex4 (MetaTrader 4) builds, and up to
3 MT5 accounts switchable at any time. Every future update is included
for the life of the plan.
Payment goes through the crypto checkout at
fxmath.com/pay/checkout.php. BTC, ETH, USDT, BNB, SOL, LTC and
DOGE are accepted and no personal details are required. The compiled files
arrive immediately after the payment confirms.
Links
- Library and free reports: https://eliteopt.fxmath.com/
- Video walkthrough: https://youtu.be/gsAk1LlNbJs
- Vendor page: https://elite.fxmath.com/
- Telegram: https://t.me/FxMath
- Email: [email protected]
MetaTrader 5Expert Advisor
Walk-ForwardRandom Forest
Grid TradingBacktest
XAUUSDForex
Discover more from FxMath Financial Solution
Subscribe to get the latest posts sent to your email.