FxMath Pip Generator EA Package
Pairs: EURUSD, GBPUSD, EURJPY, USDCAD, USDCHF, USDJPY
TimeFrame: H1
Trading Strategy: Trend/Swing
Return/DD Ratio: 34.51
Small Drawn Down: 9.19 %
Profit Factor: 1.83
Deviation” $94.01
Wins/Losses Ratio: 1.38
EA features:
-
EA Auto Installer
-
Matatrader 4 Platform
-
User Manual
-
Friendly EA Setting
-
Money Management Function
-
Works with all build +600
-
Life time update
-
Free setting for other pairs
FxMath Pip Generator System(FPG) is trend manual system and based on Commodity Channel Index (CCI), Relative Strength Index (RSI) and Momentum indicators.
What is Commodity Channel Index (CCI)?
Developed by Donald Lambert and featured in Commodities magazine in 1980, the Commodity Channel Index (CCI) is a versatile indicator that can be used to identify a new trend or warn of extreme conditions. Lambert originally developed CCI to identify cyclical turns in commodities, but the indicator can successfully applied to indices, ETFs, stocks and other securities. In general, CCI measures the current price level relative to an average price level over a given period of time. CCI is relatively high when prices are far above their average. CCI is relatively low when prices are far below their average. In this manner, CCI can be used to identify overbought and oversold levels.
What is Relative Strength Index (RSI)?
Developed J. Welles Wilder, the Relative Strength Index (RSI) is a momentum oscillator that measures the speed and change of price movements. RSI oscillates between zero and 100. Traditionally, and according to Wilder, RSI is considered overbought when above 70 and oversold when below 30. Signals can also be generated by looking for divergences, failure swings and centerline crossovers. RSI can also be used to identify the general trend.
RSI is an extremely popular momentum indicator that has been featured in a number of articles, interviews and books over the years. In particular, Constance Brown’s book, Technical Analysis for the Trading Professional, features the concept of bull market and bear market ranges for RSI. Andrew Cardwell, Brown’s RSI mentor, introduced positive and negative reversals for RSI. In addition, Cardwell turned the notion of divergence, literally and figuratively, on its head.
Wilder features RSI in his 1978 book, New Concepts in Technical Trading Systems. This book also includes the Parabolic SAR, Average True Range and the Directional Movement Concept (ADX). Despite being developed before the computer age, Wilder’s indicators have stood the test of time and remain extremely popular.
What is Momentum?
The Momentum indicator compares where the current price is in relation to where the price was in the past. How far in the past the comparison is made is up to the technical analysis trader. The calculation of Momentum is quite simple (n is the number of periods the technical trader selects):
-
The current price minus the price n-periods ago
Hence, if the current price is higher than the price in the past, then the Momentum indicator is positive. In contrast, when the current price is lower than the price in the past, then the Momentum indicator is negative.
How is working FPG?
FPG is using complicated Mathematical Formula that generated from one Learning Machine Algorithm. After generated our 100 first models with Genetic Algorithm, select the best model with highest possible profit and lowest drawn down. Again optimize this model for our pairs to fins best settings for that. Our trading pairs are:
-
EURUSD
-
GBPUSD
-
EURJPY
-
USDJPY
-
USDCAD
-
USDCHF
Enter Rules:
System finds strong trends by CCI, RSI and Momentum indicators in TimeFrame H1 and there is not any open trade, will put Buy/Sell order.
Exit Rules:
-
Hard TakeProfit that calculates by ATR indicator
-
Hard StopLoss with fixed value
-
Reverse Signal
Price: 199 USD
EA Analyzer Portfolio Report
Portfolio
Total Profit $ 30861.69
Profit in pips 32865.43 pips
Yearly Avg profit $ 10892.36
# of trades 1602
Sharpe ratio 0.22
Profit factor 1.83
Return / DD ratio 34.51
Winning % 57.93 %
Drawdown $ 894.35
% Drawdown 9.19 %
Daily Avg profit $ 29.53
Monthly Avg profit $ 907.7
Average trade $ 65.65

Strategies in portfolio
| # | Name | Symbol | Timeframe | Net Profit ($) | Net Profit (pips) | # of Trades | Sharpe Ratio | Profit Factor |
| S1 | FxMath_Pip_Generator_EURJPY_EA | EURJPY | H1 | $ 7652.15 | 9017.09 pips | 290 | 0.23 | 1.9 |
| S2 | FxMath_Pip_Generator_EURUSD_EA | EURUSD | H1 | $ 5940.6 | 6099.29 pips | 311 | 0.19 | 1.78 |
| S3 | FxMath_Pip_Generator_GBPUSD_EA | GBPUSD | H1 | $ 6115.36 | 6364.99 pips | 304 | 0.24 | 1.75 |
| S4 | FxMath_Pip_Generator_USDCAD_EA | USDCAD | H1 | $ 4003.04 | 4435.2 pips | 207 | 0.34 | 2.25 |
| S5 | FxMath_Pip_Generator_USDCHF_EA | USDCHF | H1 | $ 5625.17 | 5400.1 pips | 306 | 0.22 | 2.03 |
| S6 | FxMath_Pip_Generator_USDJPY_EA | USDJPY | H1 | $ 1525.38 | 1548.79 pips | 184 | 0.14 | 1.37 |
| # | Name | Return / DD Ratio | Winning % | Drawdown | % Drawdown | Yearly avg. profit | Monthly avg. profit | Daily avg. profit |
| S2 | FxMath_Pip_Generator_EURUSD_EA | 14.61 | 57.56 % | $ 406.48 | 23.49 % | $ 2096.68 | $ 174.72 | $ 5.69 |
| S4 | FxMath_Pip_Generator_USDCAD_EA | 11.68 | 60.87 % | $ 342.83 | 9.51 % | $ 1455.65 | $ 121.3 | $ 3.9 |
| S6 | FxMath_Pip_Generator_USDJPY_EA | 3.93 | 84.24 % | $ 388.62 | 25.74 % | $ 538.37 | $ 44.86 | $ 1.47 |
Monthly Performance ($)
| Year | Jan | Feb | Mar | Apr | May | Jun | Jul | Aug | Sep | Oct | Nov | Dec | YTD |
| 2014 | 1707.43 | 997.73 | 1106.21 | 897.04 | 569.18 | -173.78 | 165.84 | 418.19 | 614.37 | 552.83 | 198.51 | 0 | 7053.55 |
| 2013 | 1481.92 | 1666.34 | 956.33 | 925.73 | 796.99 | 2063.69 | 857.76 | 440.59 | 769.66 | 1237.49 | -755.55 | 1164.79 | 11605.74 |
| 2012 | 2045.96 | 834.22 | 1531.25 | 540.23 | 1647.54 | 1625.29 | 56.88 | 923.4 | 1151.23 | 843.12 | 399.36 | 603.93 | 12202.41 |
Stats
Strategy
| Wins/Losses Ratio | 1.38 | Payout Ratio (Avg Win/Loss) | 1.33 | Average # of Bars in Trade | 0 |
| AHPR | 0.11 | Z-Score | -3.97 | Z-Probability | 100 % |
| Expectancy | 19.26 | Deviation | $ 94.01 | Exposure | 0 % |
| Stagnation in Days | 74 | Stagnation in % | 7.08 % |
Trades
| # of Wins | 928 | # of Losses | 674 | ||||
| Gross Profit | $ 68014.49 | Gross Loss | $ -37152.83 | Average Win | $ 73.29 | Average Loss | $ -55.12 |
| Largest Win | $ 299.42 | Largest Loss | $ -173.23 | Max Consec Wins | 13 | Max Consec Losses | 7 |
| Avg Consec Wins | 2.63 | Avg Consec Loss | 1.91 | Avg # of Bars in Wins | 0 | Avg # of Bars in Losses | 0 |
Charts
Click on the chart to see bigger image
 P/L by hour P/L by hour |
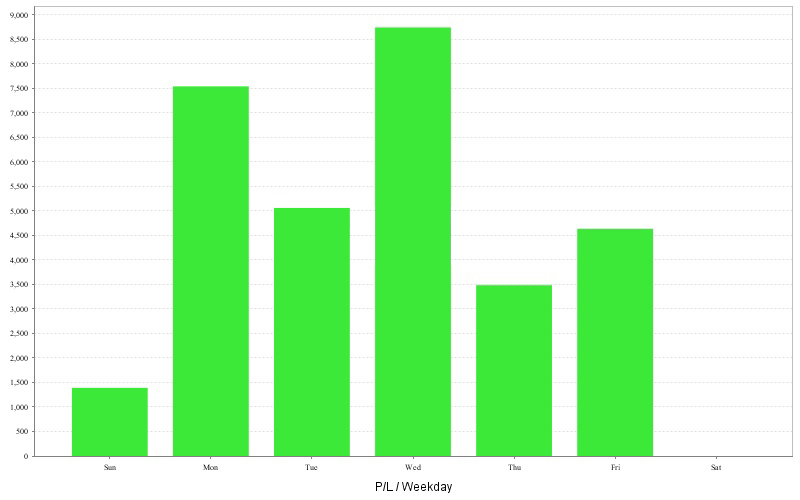 P/L by weekday P/L by weekday |
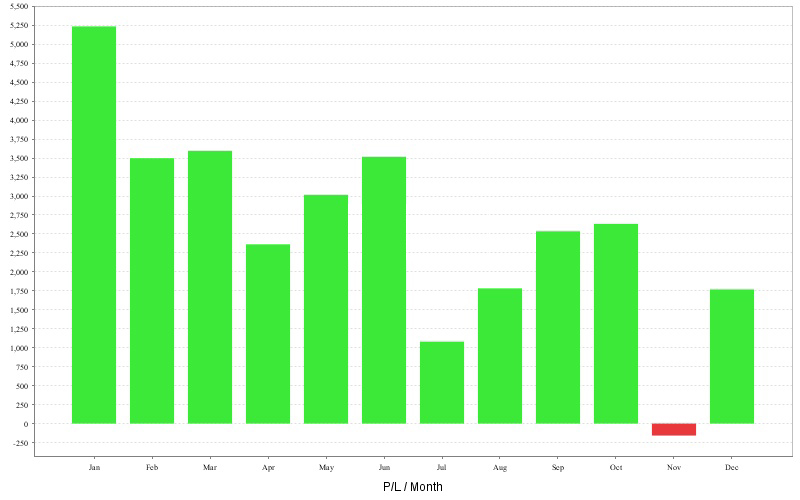 P/L by month P/L by month |
 Long vs Short trades Long vs Short trades |
 Long vs Short P/L Long vs Short P/L |
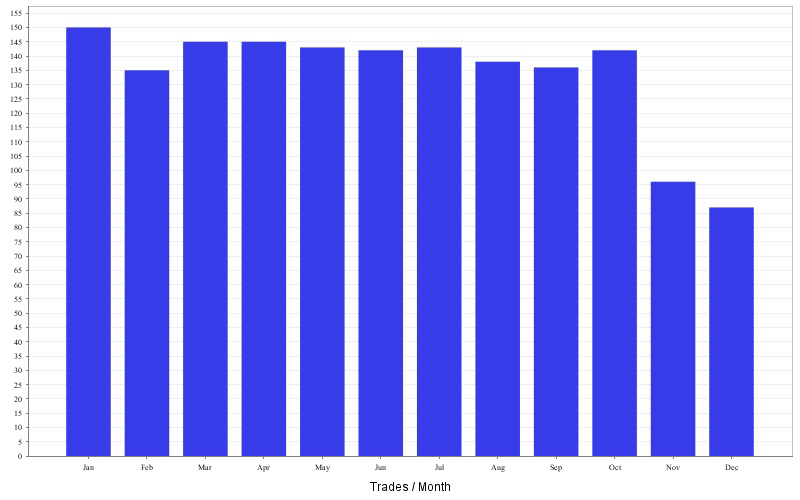 Trades by month Trades by month |
 P/L by trade duration P/L by trade duration |
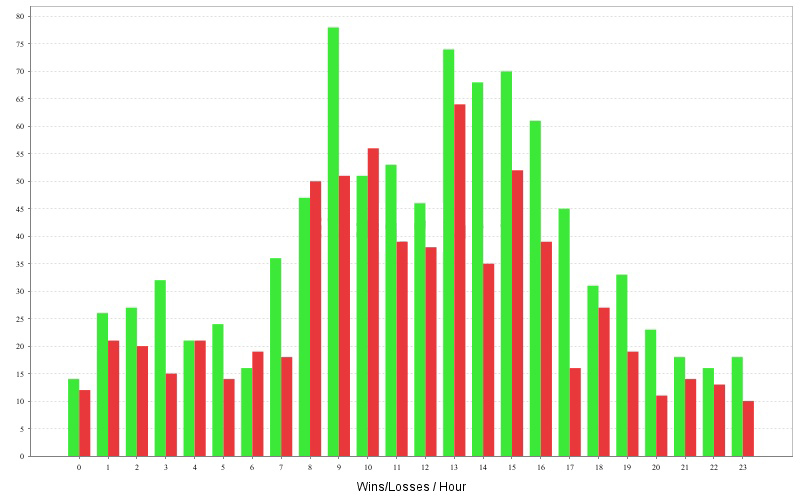 Wins/Losses by hour Wins/Losses by hour |
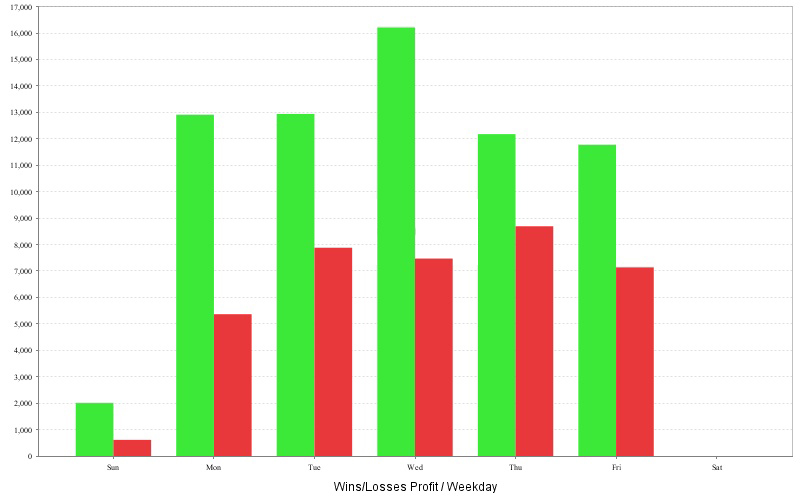 Wins/Losses Profit by weekday Wins/Losses Profit by weekday |
![]()
30 DAY MONEY BACK GUARANTEE
In the event we are unable to accord you product support or we are unable to fix a bug in the software within a reasonable time, you are entitled to our 30-day, no-hassle money-back guarantee. Your account will be credited promptly.
You are also entitled to a 12 Months Performance guarantee. What does this mean? If metaquotes were to do some changes like they did with build 600. You are entitled to a free update within one year from your date of purchase.
Price: 199 USD