USDJPY Technical Analysis: Bearish Bat Pattern
Daily Timeframe | Harmonic Reversal Setup
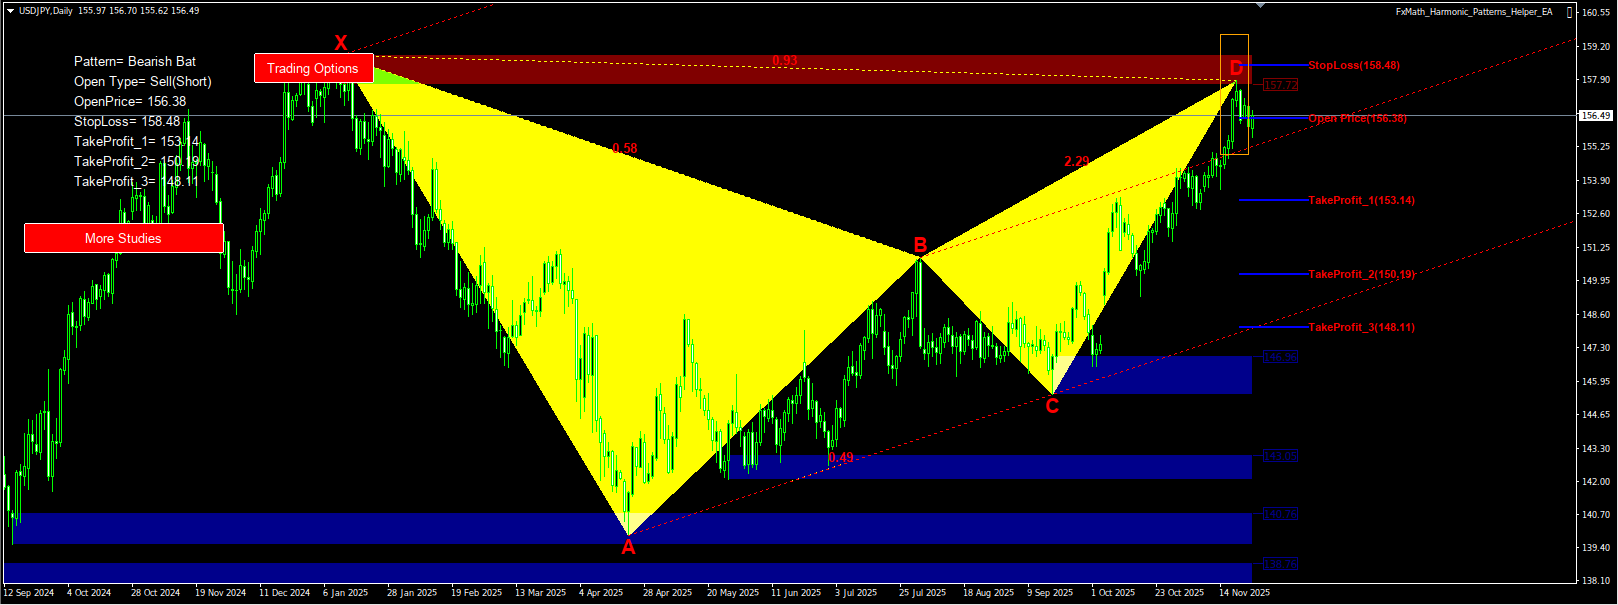
The US Dollar vs. Japanese Yen (USDJPY) pair has formed a distinct Bearish Bat harmonic pattern on the Daily timeframe. This geometric structure often signals a potential trend reversal or a significant retracement.
The “Bat” pattern is characterized by a specific B-point retracement of approximately 38.2% to 50% of the XA leg, and a deep D-point completion at the 88.6% Fibonacci retracement of XA. As seen in the chart above, the price action has reacted precisely within the Potential Reversal Zone (PRZ).
Trade Parameters
Based on the FxMath Harmonic Patterns Helper, here are the identified key levels for this setup:
| Parameter | Price Level | Notes |
|---|---|---|
| Pattern | Bearish Bat | Trend Reversal (Sell) |
| Open Price (Entry) | 156.38 – 157.72 | The D-Point completion zone. |
| Stop Loss | 158.48 | Placed strictly above Point X (Pattern invalidation). |
| Take Profit 1 | 153.14 | 38.2% Retracement of CD leg. |
| Take Profit 2 | 150.19 | 61.8% Retracement of CD leg. |
| Take Profit 3 | 148.11 | Extended Target. |
Trade Like a Pro
Stop drawing lines manually. Identify high-probability setups like this automatically on every timeframe.
Get the FxMath Harmonic Patterns Scanner for MT4 & MT5.
Lifetime License
3 Accounts
Anytime Switch
Risk Warning: Trading Forex and CFDs involves significant risk and can result in the loss of your invested capital. You should not invest more than you can afford to lose and should ensure that you fully understand the risks involved.
Discover more from FxMath Financial Solution
Subscribe to get the latest posts sent to your email.