FxMath Financial Solution
FxMath Aurum ML — 16 November 2026: +$40.48 on Gold, +404.8 Pips With a 40% Win Rate
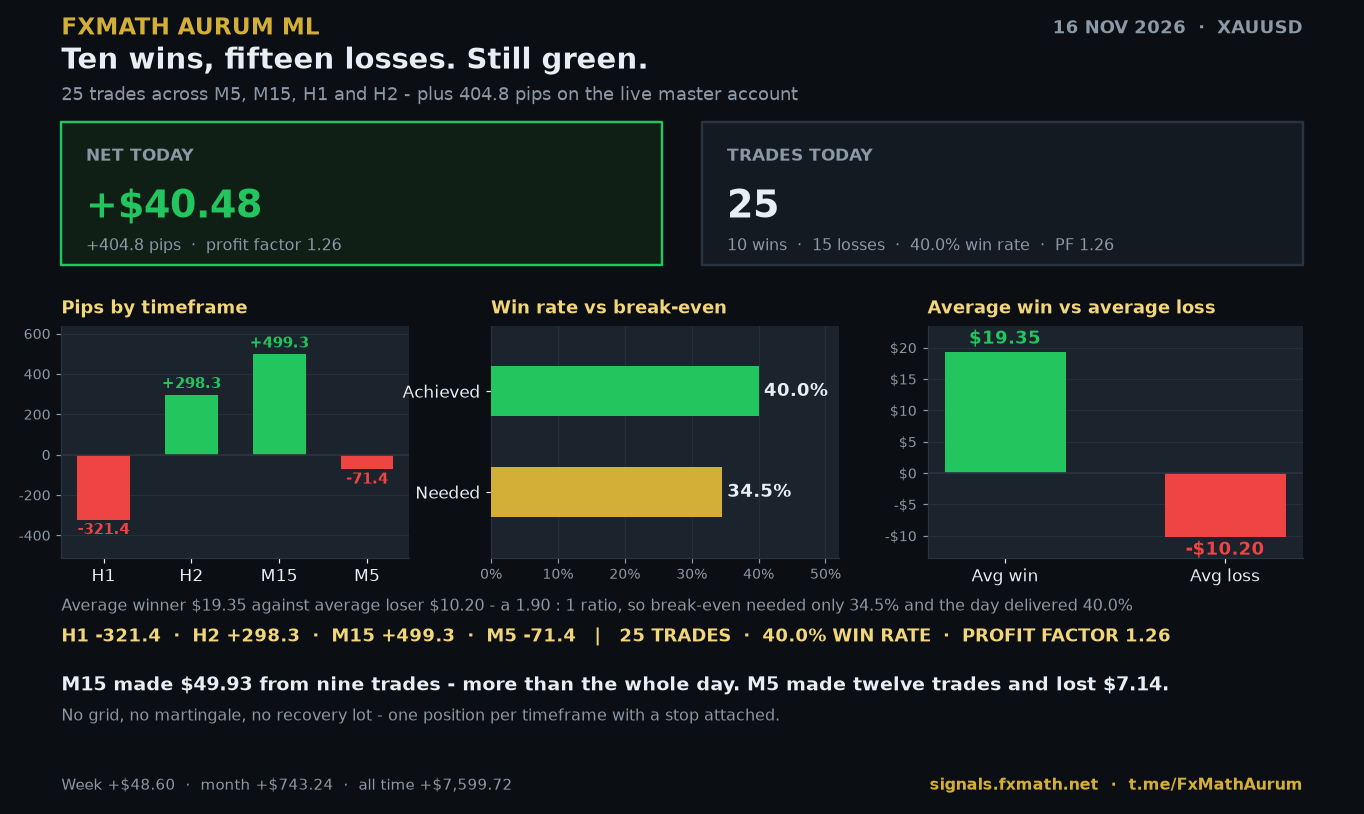
Twenty-five trades on Gold closed today at +$40.48 (+404.8 pips) with a 40.0% win rate and a profit factor of 1.26. Fifteen of those twenty-five trades lost money, and the account still finished green — because one winner was worth almost two losers.
Executive Summary
25 trades · 10W / 15L · 40.0% win rate · +$40.48 (+404.8 pips) · Profit Factor 1.26
Average winner +$19.35 vs average loser -$10.20 — a 1.90 : 1 ratio, so break-even needed only 34.5%. Delivered 40.0%.
Timeframes: M15 +$49.93 (9 trades) · H2 +$29.83 (2 trades) · M5 -$7.14 (12 trades) · H1 -$32.14 (2 trades).
Week +$48.60 · Month +$743.24 · All time +$7,599.72 (+75,997.2 pips)
Today at a Glance
Ten winners, fifteen losers. Read that again: sixty percent of the trades lost, and the day still banked forty dollars. That is not a lucky streak — it is the arithmetic of a payoff-driven system, and it is the same arithmetic that keeps the monthly and all-time figures pointing up.
Breakdown by Timeframe
| Timeframe | Trades | Wins | Losses | Win rate | Net P&L | Pips | Avg win | Avg loss | PF |
|---|---|---|---|---|---|---|---|---|---|
| H1 | 2 | 0 | 2 | 0.0% | -$32.14 | -321.4 | — | -$16.07 | 0.00 |
| H2 | 2 | 1 | 1 | 50.0% | +$29.83 | +298.3 | +$54.63 | -$24.80 | 2.20 |
| M15 | 9 | 5 | 4 | 55.6% | +$49.93 | +499.3 | +$18.13 | -$10.19 | 2.23 |
| M5 | 12 | 4 | 8 | 33.3% | -$7.14 | -71.4 | +$12.06 | -$6.92 | 0.87 |
| Total | 25 | 10 | 15 | 40.0% | +$40.48 | +404.8 | +$19.35 | -$10.20 | 1.26 |
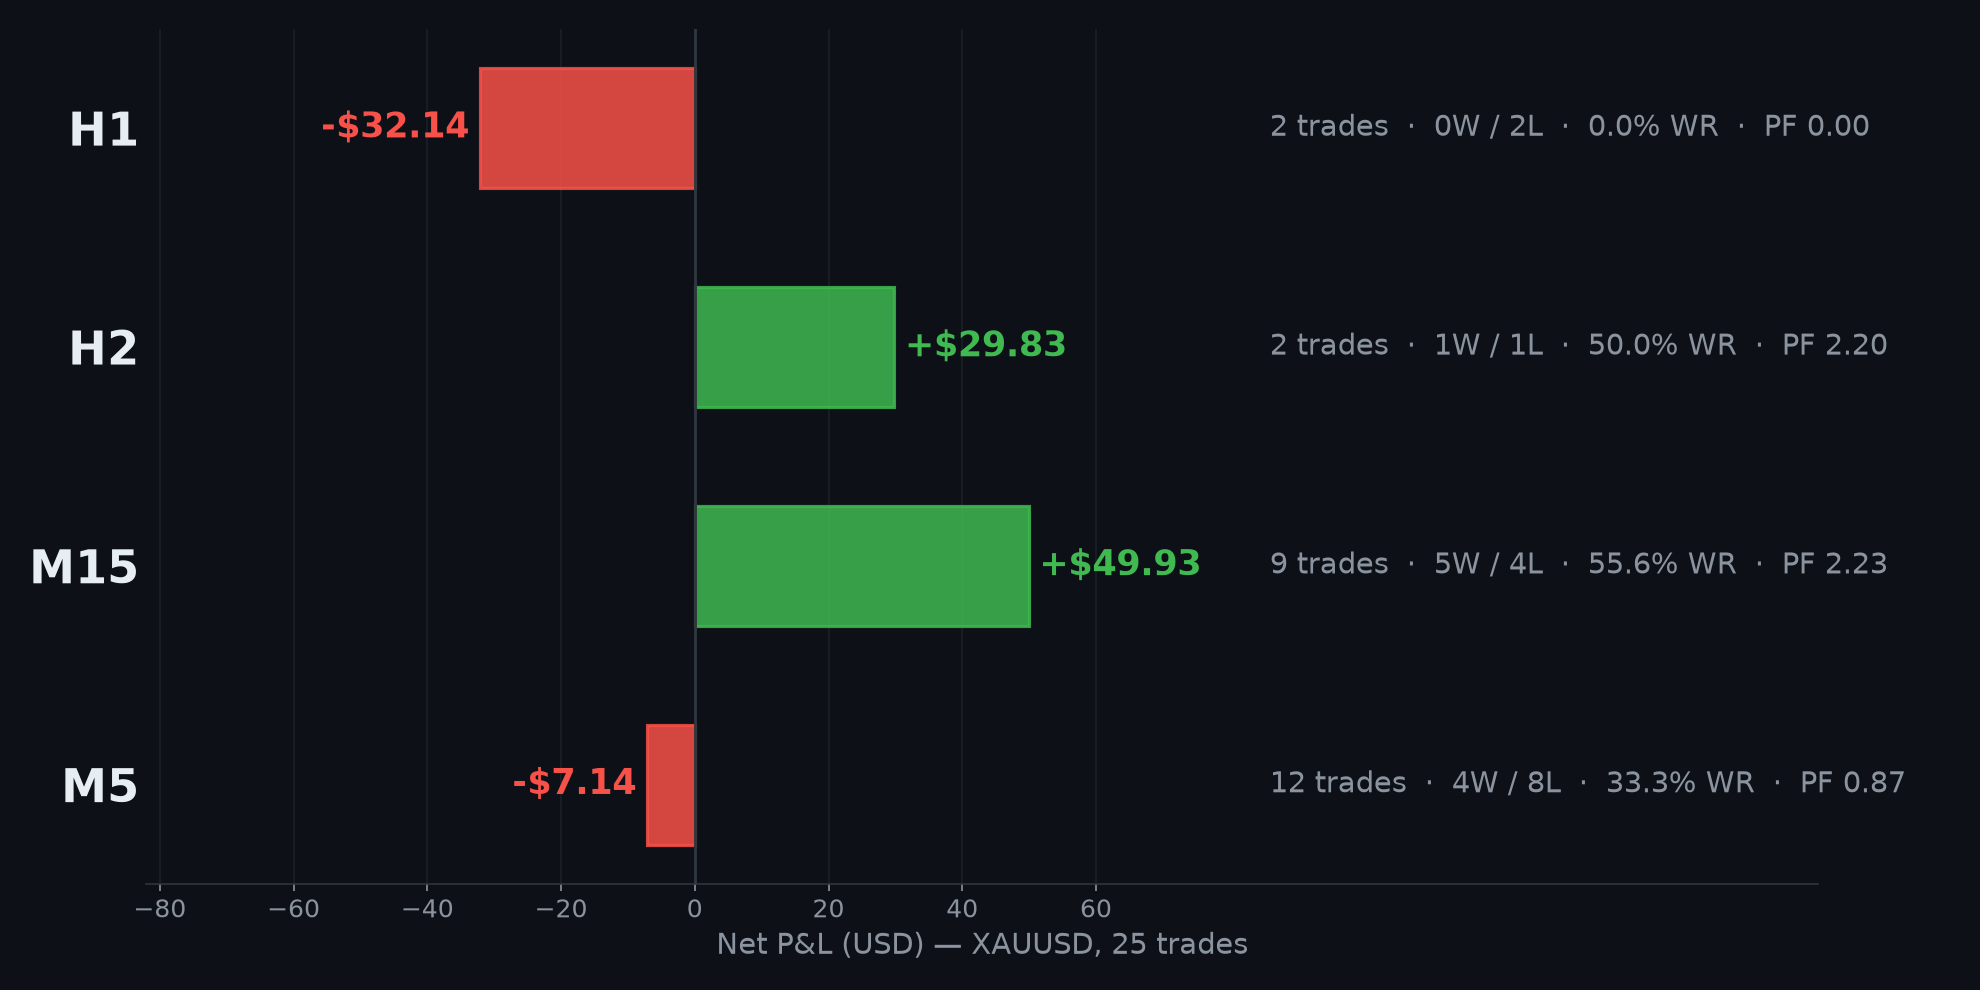
Every number in this report fits one sentence: M15 made more profit than the whole day, and M5 did half the work without adding to it. Nine M15 trades produced +$49.93; twelve M5 trades produced -$7.14. The busiest timeframe was not the profitable one — it never is.
How the Day Added Up
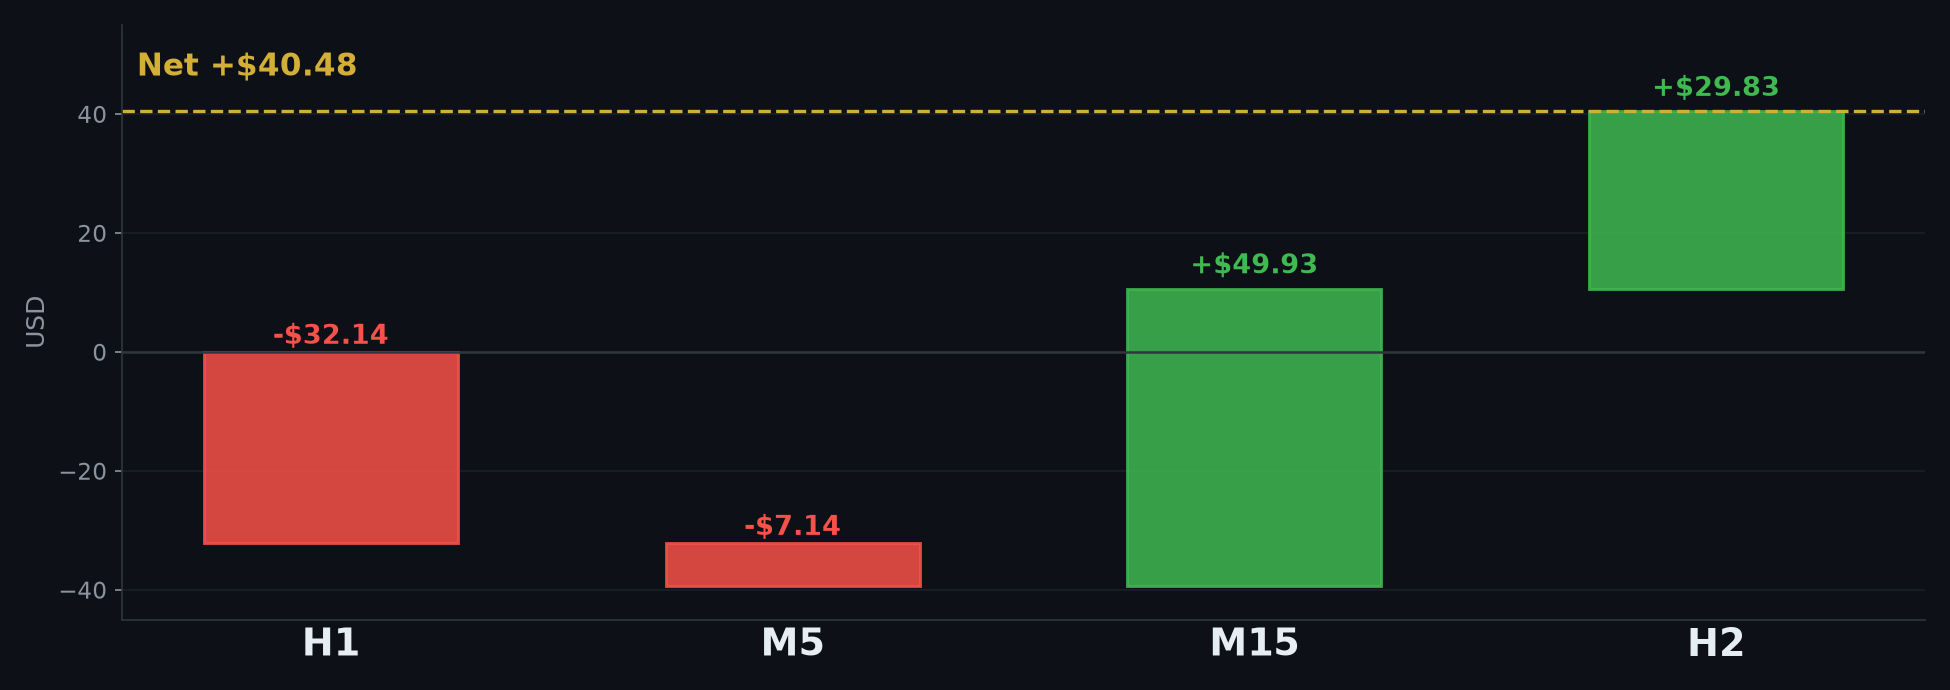
Build the session chronologically and the shape is obvious. H1 opened the day with two stops (-$32.14). M5 added another -$7.14. The book sat at -$39.28 — with more than half the day’s trades already gone. Then M15 delivered +$49.93 and H2 +$29.83, and the session closed at +$40.48.
Why a 40% Win Rate Is Enough
The average winner made +$19.35. The average loser cost -$10.20. That is 1.90 : 1 — a winner was worth almost two losers. At that ratio a system needs only a 34.5% win rate to break even. Today it delivered 40.0%.
Expectancy per trade: +$1.62, across 25 trades. Small, consistent, repeatable — and it is the only number that decides whether a month compounds or bleeds. A 40% win rate looks like a losing system until you put the payoff ratio next to it.
| Scope | Avg win / avg loss | Ratio | Break-even needed | Delivered | Margin |
|---|---|---|---|---|---|
| Whole system | +$19.35 / -$10.20 | 1.90 : 1 | 34.5% | 40.0% | +5.5 pts |
| H2 | +$54.63 / -$24.80 | 2.20 : 1 | 31.2% | 50.0% | +18.8 pts |
| M15 | +$18.13 / -$10.19 | 1.78 : 1 | 36.0% | 55.6% | +19.6 pts |
| M5 | +$12.06 / -$6.92 | 1.74 : 1 | 36.5% | 33.3% | -3.2 pts |
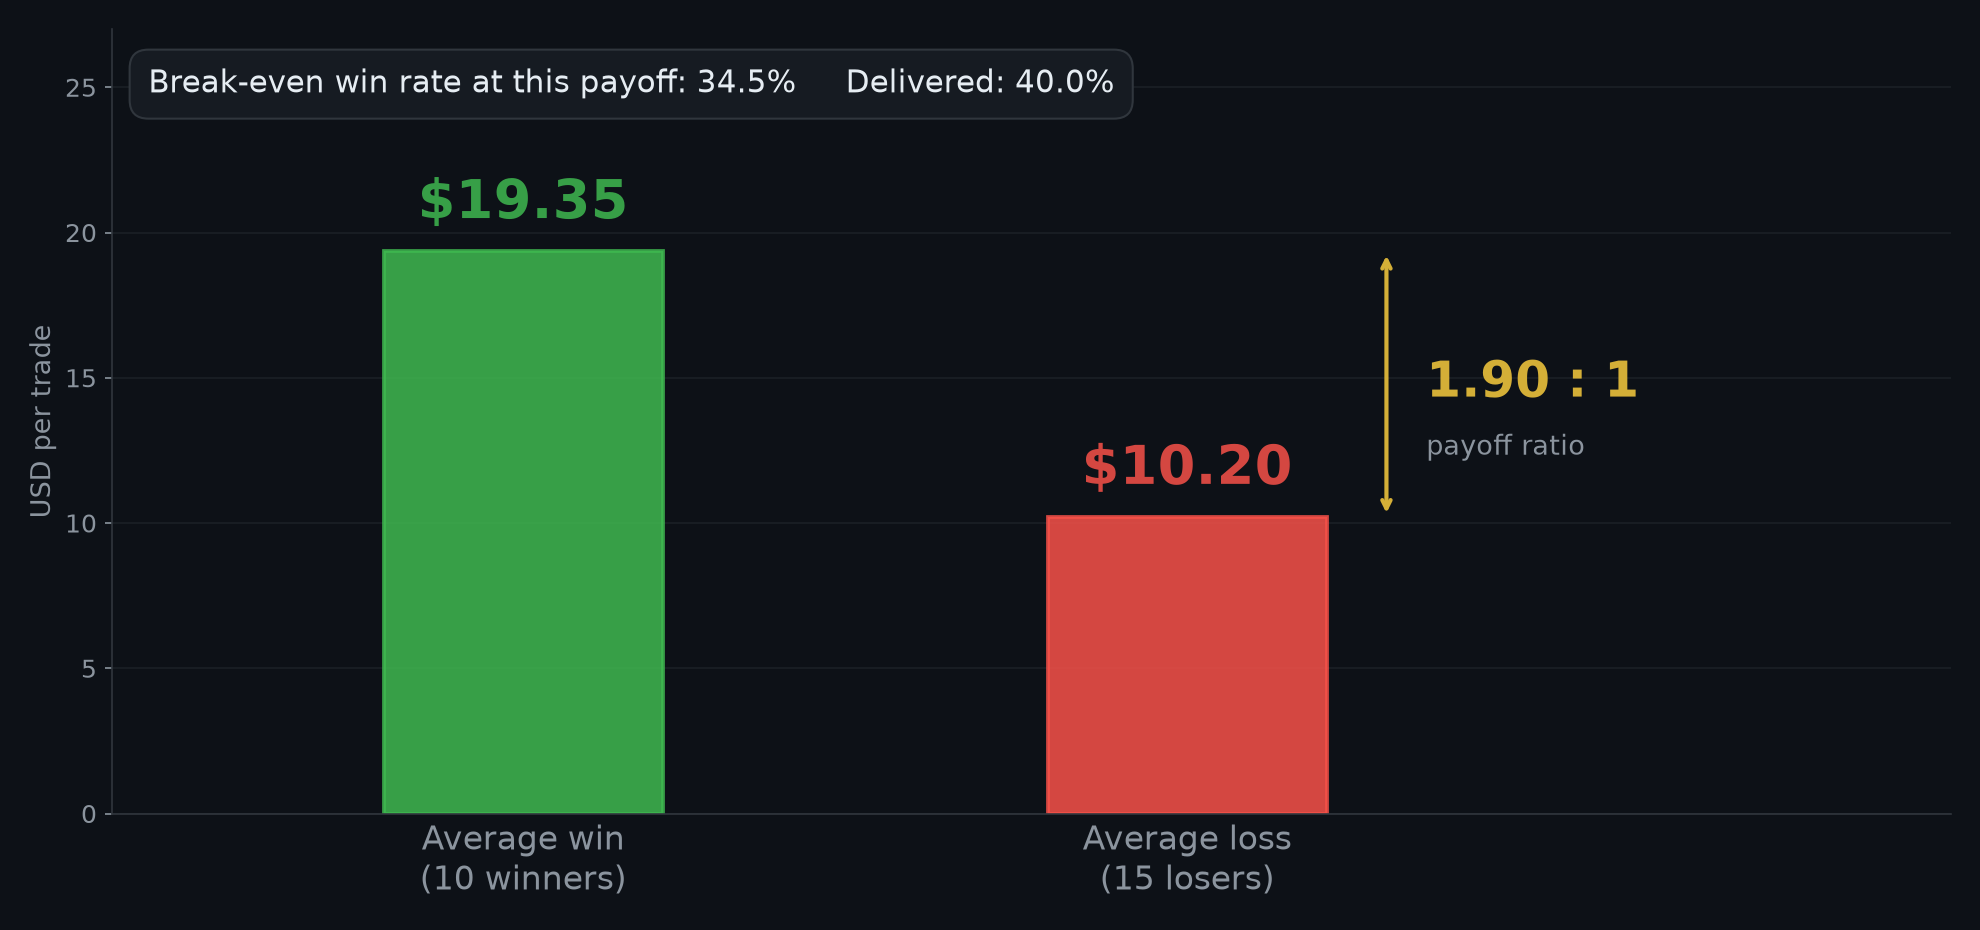
Win rate is not the edge. The distance between the win rate and the break-even rate its own reward-to-risk demands is the edge.
Note the M5 row: a 33.3% win rate against a 36.5% break-even. The fast timeframe finished slightly under water — and only slightly, because its average loss of $6.92 stayed below its average win of $12.06. That is what a controlled loser looks like: twelve attempts, eight stops, seven dollars of damage.
The Timeframe That Carried the Day
M15 — 9 trades, 5W / 4L, 55.6% win rate, +$49.93 (+499.3 pips), PF 2.23. The best block of the session by every measure: most profit, best hit rate, best profit factor, and an average trade of +$5.55. When the fast timeframe chopped and the H1 swings went the wrong way, the mid timeframe quietly produced more than the entire day’s net result.
H2 — 2 trades, 1W / 1L, +$29.83, PF 2.20. The single winner at +$54.63 and the single loser at -$24.80. One decision, taken well, out of two attempts.
H1 — 2 trades, 0W / 2L, -$32.14, PF 0.00. The mirror image. Same system, same instrument, opposite outcome — and stopped at $16.07 per trade instead of being averaged down into something three times larger.
The Risk Model Behind It
None of the above requires a grid, a martingale, an averaging-down sequence, or a hidden recovery position sitting behind a loser. Aurum ML holds one position per timeframe, with stop loss and take profit attached at entry. When a stop is hit, the loss is closed and the EA waits for the next signal.
That is why eight M5 stops cost $55.36 in total instead of compounding into a drawdown, why a full H1 stop cost $16.07, and why a day with fifteen losers still closed at +$40.48. It is also why the system stays FIFO compatible for US brokers and remains viable on a $50–$100 account.
Zoomed Out — Same Account, Today Included
| Period | Net P&L | Pips | What it means |
|---|---|---|---|
| Today | +$40.48 | +404.8 | 40% win rate, winners 1.90× the size of losers |
| This week | +$48.60 | +486.0 | 83% of the week was earned today |
| This month | +$743.24 | +7,432.4 | One losing-majority day inside a green month |
| All time | +$7,599.72 | +75,997.2 | Since the master account started, every trade published |
A green day inside a green week inside a green month, built on a 40% hit rate. That shape is rarer than it looks, and it still explains almost nothing on its own — which is exactly why the whole record, including the fifteen losing trades from today, stays public.
Verify It Yourself — Free, No License
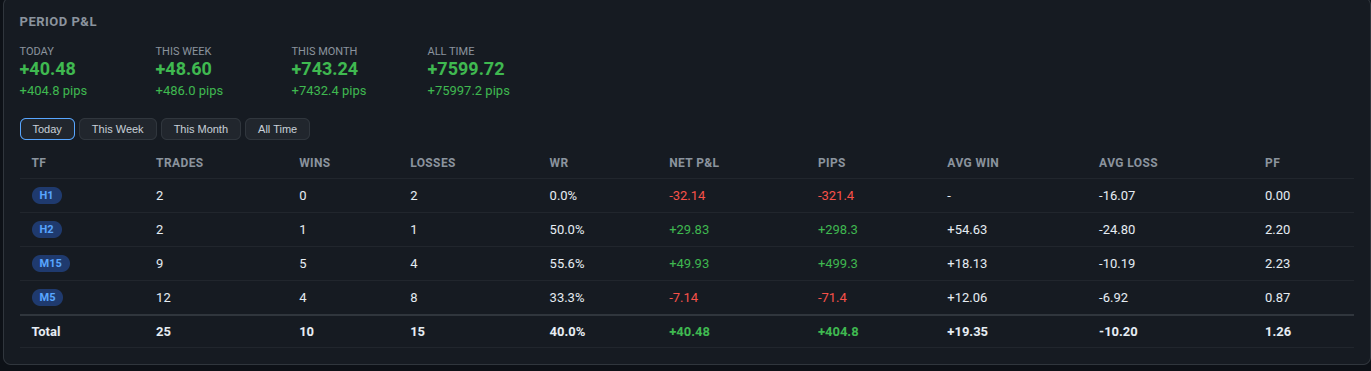
The panel above is the public account, not a marketing screenshot. signals.fxmath.net refreshes every ten seconds with open positions, cumulative stats and every closed trade — all fifteen losers included. The free Telegram channel t.me/FxMathAurum pushes each open and each close the moment it happens. No license, no email, no card.
What Aurum ML Is
A multi-timeframe XAUUSD trade copier for MT4 and MT5. One master Expert Advisor analyses gold and broadcasts every signal; unlimited slave EAs receive and execute them instantly on your own terminal, at your own broker, on your own account. You choose one timeframe, two, or all four per license.
- Timeframes: M5, M15, H1 and H2 — one position per timeframe, SL/TP attached at entry.
- Risk: no grid, no martingale, no averaging down, no recovery lot. FIFO-safe, viable from $50–$100.
- Filters: trading hours, max signal age, price-deviation guard, minimum confidence.
- Alerts: real-time Telegram notifications for every open and close, free.
Pricing & Payment
Same features on every plan — only the duration differs. Each license covers one MT4 or MT5 account with all timeframes. The live dashboard and Telegram alerts are free for everyone, no license required.
Pay directly at the secure checkout (fxmath.com/pay) or via the storefront. Need help choosing or upgrading? Contact @FxMath on Telegram or email [email protected].
Tags
FxMathAurum MLDaily ResultsXAUUSDGoldProfit FactorWin RateRisk RewardTrade CopierAlgorithmic TradingMT4MT5
Discover more from FxMath Financial Solution
Subscribe to get the latest posts sent to your email.