FxMath Financial Solution
FxMath Aurum ML Daily Report — 10 November 2026: +$62.25 on Gold, 44.4% Win Rate, 27 Trades
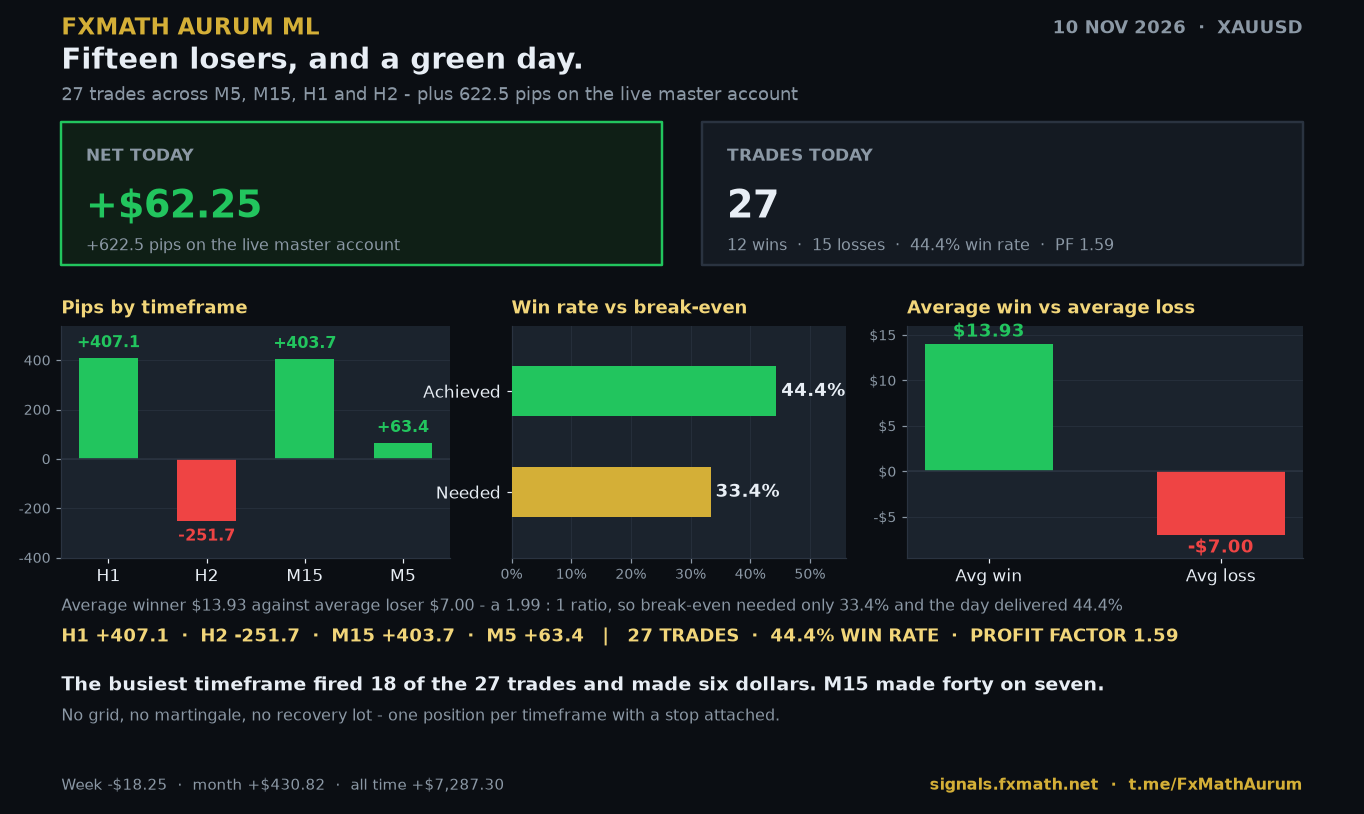
FxMath Aurum ML closed 10 November 2026 up +$62.25 on Gold, or +622.5 pips, across 27 trades — twelve winners against fifteen losers, a 44.4% win rate and a profit factor of 1.59. Fewer than half the trades won, and the session still finished green. This report shows exactly why.
27 trades · 12W / 15L · 44.4% win rate · +622.5 pips (+$62.25) · Profit Factor 1.59 · week -$18.25 · month +$430.82 · all time +$7,287.30
Winners were twice the size of losers: average +$13.93 against -$7.00 — a 1.99 : 1 ratio. Break-even at that ratio needs only 33.4%; the system delivered 44.4%. M5 fired 18 of the 27 trades for +$6.34; M15 made +$40.37 on seven.
Period P&L
Today’s Session
Performance by Timeframe
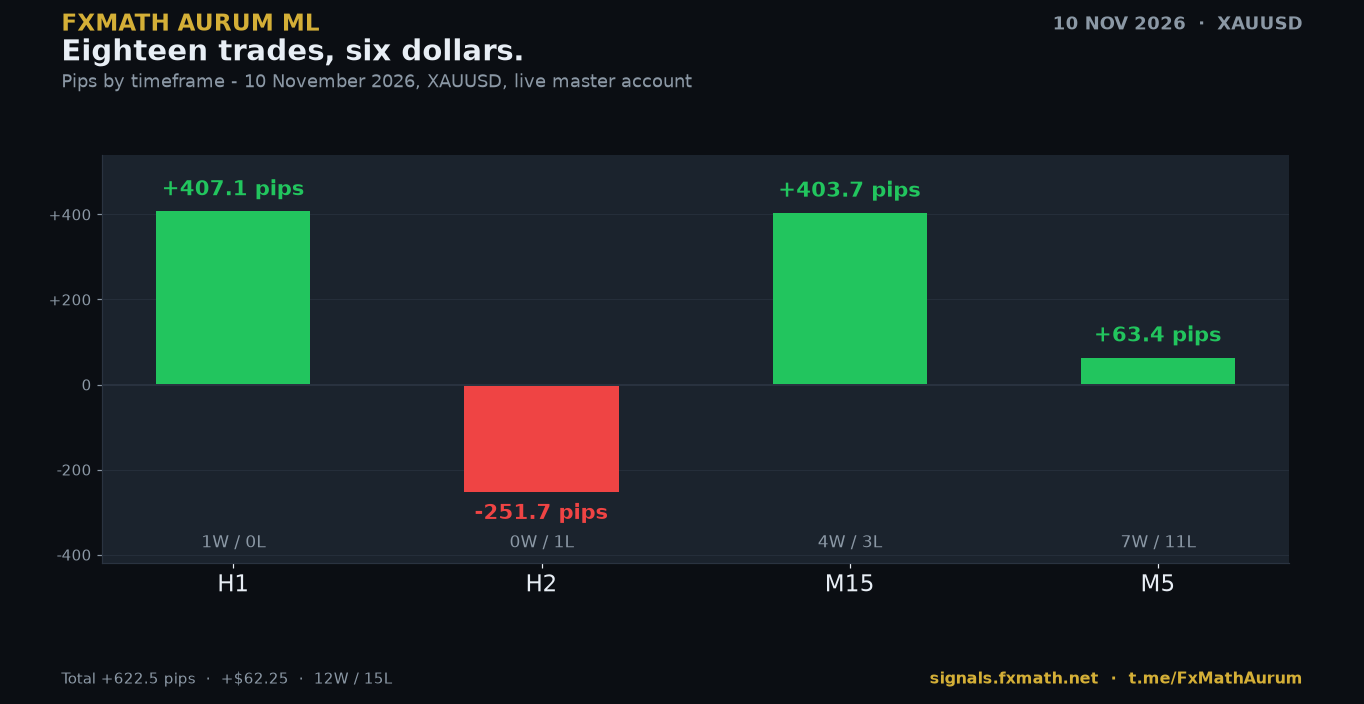
Four timeframes traded, three finished green. The busiest timeframe did the least work; the quietest one took a single trade and made more than eighteen of them combined.
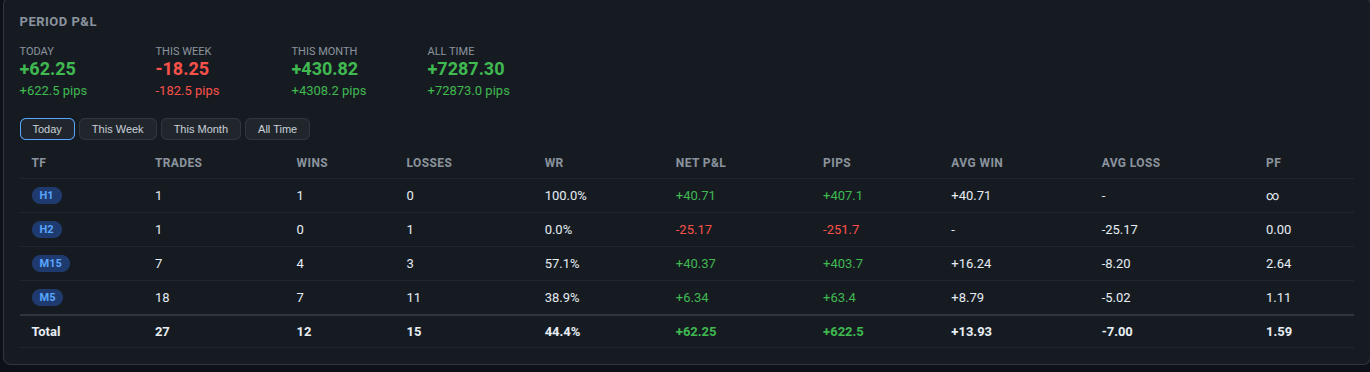
| TF | Trades | Wins | Losses | Win Rate | Net P&L | Pips | Avg Win | Avg Loss | PF |
|---|---|---|---|---|---|---|---|---|---|
| H1 | 1 | 1 | 0 | 100.0% | +$40.71 | +407.1 | +40.71 | – | ∞ |
| H2 | 1 | 0 | 1 | 0.0% | -$25.17 | -251.7 | – | -25.17 | 0.00 |
| M15 | 7 | 4 | 3 | 57.1% | +$40.37 | +403.7 | +16.24 | -8.20 | 2.64 |
| M5 | 18 | 7 | 11 | 38.9% | +$6.34 | +63.4 | +8.79 | -5.02 | 1.11 |
| TOTAL | 27 | 12 | 15 | 44.4% | +$62.25 | +622.5 | +13.93 | -7.00 | 1.59 |
What the table says
- H1 — 1 trade, 1 winner: +407.1 pips and +$40.71. A single decision produced more profit than eighteen M5 trades.
- H2 — 1 trade, 1 loser: -$251.7 pips, -$25.17. The only red print of the day, and the reason the setup carries a hard stop on every position.
- M15 — 7 trades, 4W / 3L: +403.7 pips, +$40.37 at profit factor 2.64. The cleanest session of the day: 57.1% delivered against a 33.6% break-even.
- M5 — 18 trades, 7W / 11L: +63.4 pips, +$6.34 at profit factor 1.11. Eighteen trades, two thirds of the day’s total order flow, and six dollars of profit.
The Arithmetic of a +$62.25 Day
This is the part that actually explains the result, and it is not about win rate. It is about asymmetry.
- Average winning trade: +$13.93 (+139.3 pips)
- Average losing trade: -$7.00 (-70.0 pips)
- Winner-to-loser ratio: 1.99 : 1 — the average winner was twice the average loser
- Break-even win rate at 1.99 : 1: 33.4%
- Win rate delivered: 44.4% — 11.0 points of margin
Eleven points of margin, spread across 27 trades, is $62.25. Flip the ratio and the identical signals lose roughly $90: had the average loser been twice the average winner, a 44.4% hit rate would not have saved the session. The ratio decided the outcome, not the frequency.
The same day, seen through M15 and M5
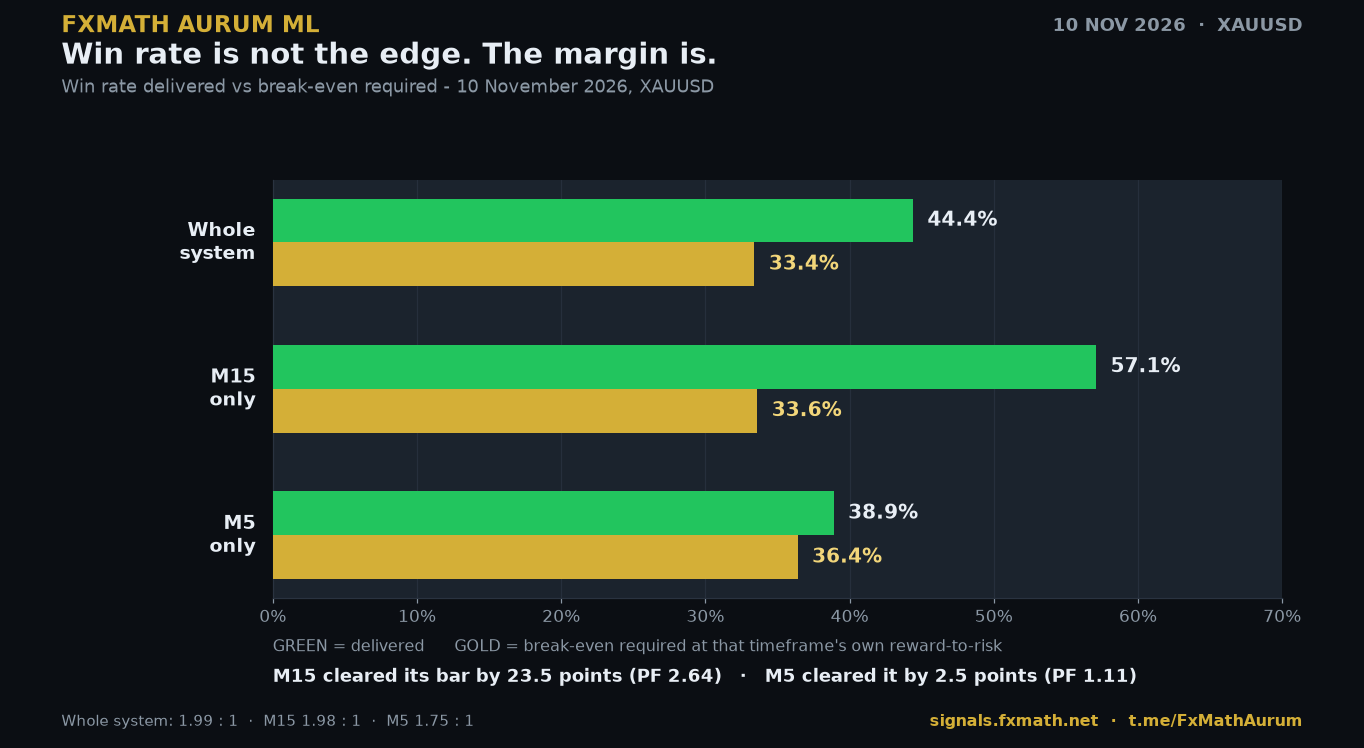
- M15: average winner +$16.24 against average loser -$8.20 → 1.98 : 1 → break-even 33.6% → delivered 57.1% → 23.5 points of margin → profit factor 2.64.
- M5: average winner +$8.79 against average loser -$5.02 → 1.75 : 1 → break-even 36.4% → delivered 38.9% → 2.5 points of margin → profit factor 1.11.
Same system, same engine, same risk rules, same session. What separated a $40 timeframe from a $6 timeframe was not entry quality — it was how far the delivered win rate sat above the break-even rate that timeframe’s own reward-to-risk required.
Why a green day stays a sixty-dollar day
No grid. No martingale. No averaging down. No hidden recovery position behind the loser. One position per timeframe, stop loss and take profit attached at entry, and when the stop hits the loss is closed and the EA waits for the next signal. That is why a full H2 stop cost $25.17 rather than a multiple of it — and why the system remains 100% FIFO compatible for US brokers and viable from a $50–$100 account.
Zoomed Out — Same Account
| Period | Net P&L | Pips | Context |
|---|---|---|---|
| Today | +$62.25 | +622.5 | A 44.4% win rate carried by winners twice the size of losers |
| This week | -$18.25 | -182.5 | Today took the week from about -$80 back to -$18 — most of it, not all |
| This month | +$430.82 | +4,308.2 | Ten days in, still up four hundred and thirty dollars |
| All time | +$7,287.30 | +72,873.0 | Since the master account started publishing |
A green day inside a red week inside a green month is the normal shape of a real equity curve. No single session — won or lost — explains a record on its own.
Full Transparency — Verify Every Number
Nothing in this report is a screenshot you have to trust. Every trade is broadcast before the outcome is known, winners and losers alike — including all fifteen losing trades from today.
- Live dashboard: signals.fxmath.net — open positions, cumulative stats and every closed trade, refreshed every 10 seconds.
- Free Telegram signals: t.me/FxMathAurum — a notification the moment any position opens or closes. No license, no email, no card.
- Full session on video: youtu.be/gchJnXRb9Uo — the narrated breakdown of all 27 trades.
- Every daily review in one place: Aurum ML playlist.
Pricing & Payment
Same features on every plan — only the duration differs. Each license covers one MT4 or MT5 account with all timeframes (M5, M15, H1, H2). The live dashboard and Telegram alerts are free for everyone — no license required.
Pay directly at the secure checkout (fxmath.com/pay) or via the storefront. Need help choosing or upgrading? Contact @FxMath on Telegram or email [email protected]. Prefer to see results first? Watch live trades on the dashboard or the free Telegram channel before buying.
Tags
FxMathAurum MLDaily ReportXAUUSDGoldMachine LearningAlgorithmic TradingForexTrade Copier
Discover more from FxMath Financial Solution
Subscribe to get the latest posts sent to your email.